Ethereum Price Analysis: ETH Rebounds From $2K, but the Danger Isn’t Over
Ethereum has extended its decline toward the $2K mark after losing the ascending channel that had supported its recovery since June. Trading around $2.05K, ETH is now approaching a key demand zone that could decide whether the correction stabilizes or develops into a deeper move. Meanwhile, the Coinbase Premium Index remains firmly negative, pointing to weak demand from US-based investors.
Ethereum Price Analysis: The Daily Chart
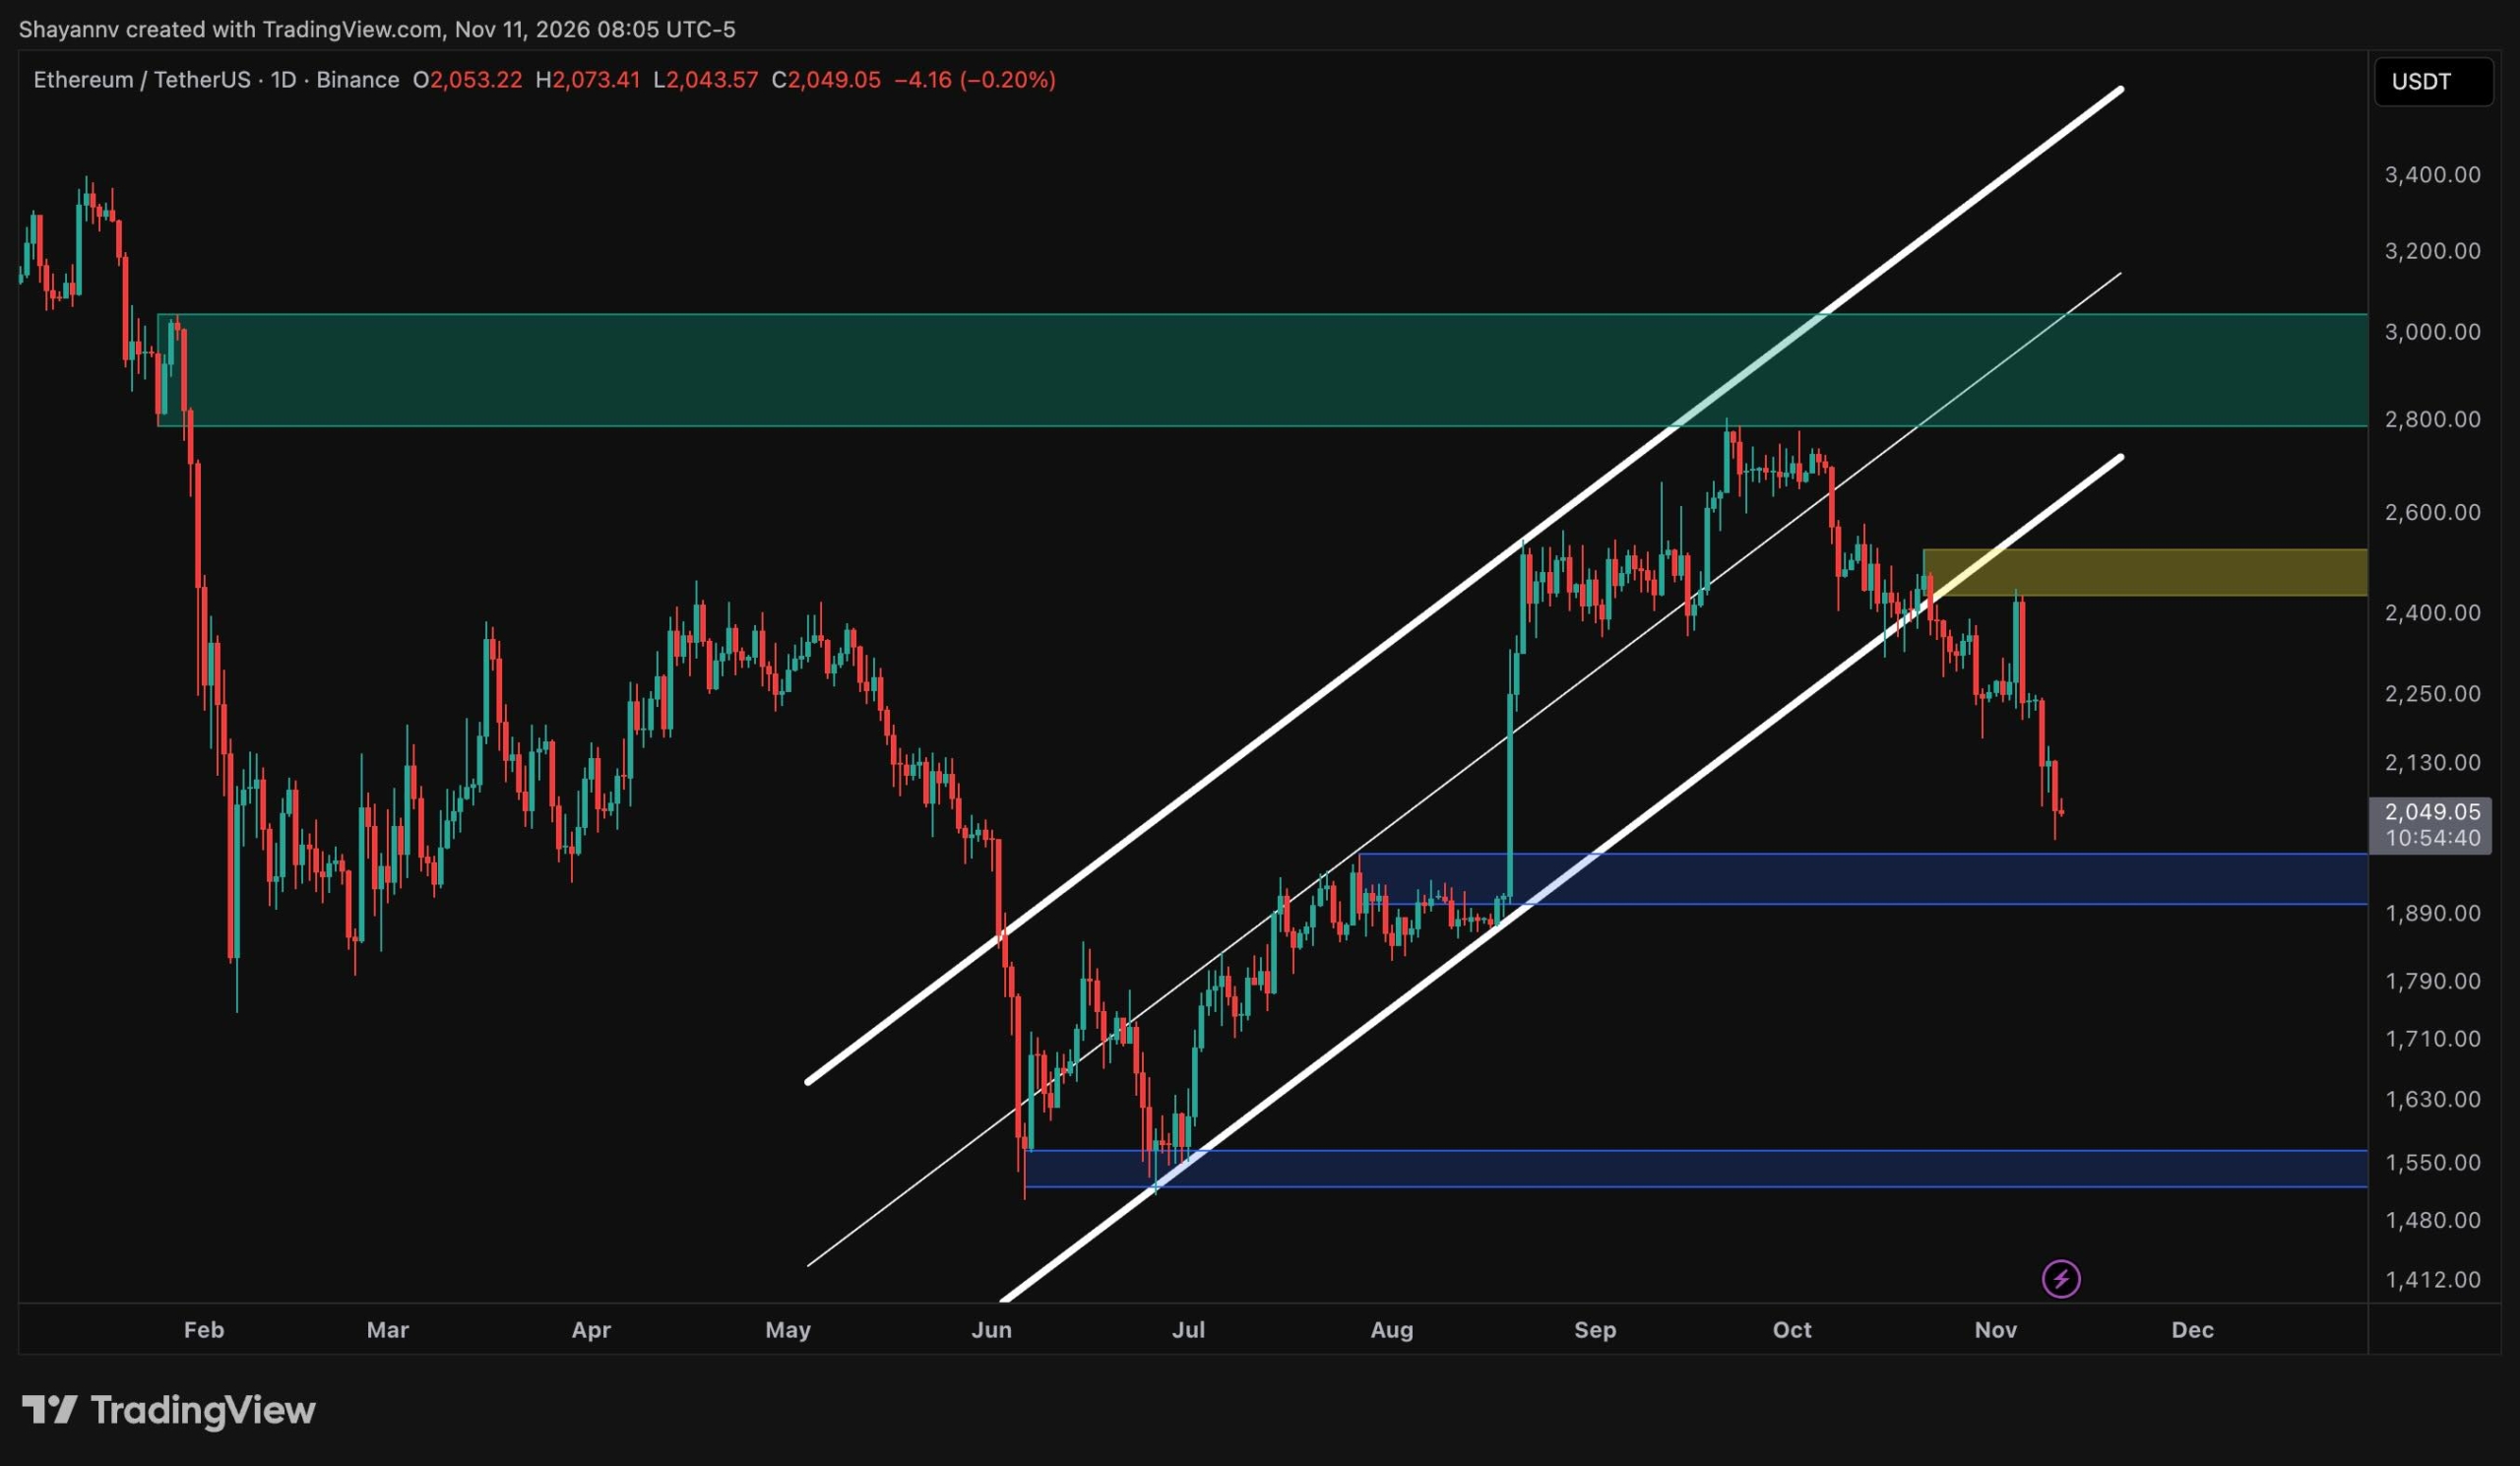
On the daily timeframe, Ethereum broke the lower boundary of its ascending channel in late October after failing to clear the $2.8K-$3K supply zone. The early-November rebound retested the $2.5K bearish order block and was sharply rejected, turning the former support into resistance and confirming the shift in structure.
The immediate focus is the $2K demand zone, which marks the consolidation range that preceded the sharp August rally. Holding this area could allow ETH to stabilize and attempt a recovery toward $2.5K, where the broken channel boundary and recent rejection create a significant resistance confluence. Reclaiming it would be needed before the $2.8K-3K supply zone comes back into focus.
Conversely, a decisive daily close below $1.9K would remove the base of the summer rally and leave little visible support until the $1.5K June bear market lows.
ETH/USDT 4-Hour Chart
The 4-hour chart shows ETH trading within a descending channel since early October, marked by consistent lower highs and lower lows. The rally on November 4 reached the upper boundary near $2.45K, just beneath the $2.5K supply zone, before sellers regained control and drove the price through the $2.2K support level.
That breakdown accelerated the decline, and ETH briefly slipped below the channel’s lower boundary to approximately $2K before bouncing back toward $2.05K. The modest rebound suggests some buyers are responding, but the price remains pinned near the lower trendline without any clear sign of reversal.
A sustained recovery could trigger a relief bounce toward $2.2K, which sellers could now defend as resistance after the recent breakdown. On the other hand, a confirmed move beneath the lower boundary would expose the $2K-$1.9K demand zone, leaving the short-term structure clearly in favor of sellers until a higher high is formed.

On-Chain Analysis
The Coinbase Premium Index on CryptoQuant measures the price gap between ETH on Coinbase, a venue widely used by US investors, and Binance. Positive readings indicate stronger buying from US participants, while negative values suggest weaker demand or heavier selling on Coinbase relative to the broader market.
Historically, the metric has tracked ETH’s major trends. The index held mostly positive during the 2025 rally toward $4.8K and turned persistently negative through the subsequent decline. It briefly recovered above zero in August, coinciding with the rally toward $2.8K, before sliding back into negative territory and printing readings near -0.2 in recent weeks. The latest value stands at approximately -0.12.
However, a negative premium does not by itself confirm further downside, as it reflects relative demand rather than absolute selling volume. Still, the absence of US buying pressure makes the $2K support zone even more critical, and the index moving back above zero would be important, as it provides a stronger sign that demand is returning alongside any recovery attempt.

The post Ethereum Price Analysis: ETH Rebounds From $2K, but the Danger Isn’t Over appeared first on CryptoPotato.
About The Author


