Bitcoin Realized Cap Sets New All-Time High, Market Cap Next?
On-chain data shows the Bitcoin Realized Cap has set a new all-time high (ATH) recently as the market has witnessed sharp capital inflows.
Bitcoin Realized Cap Has Just Set A New Record
According to data from the on-chain analytics firm Glassnode, the capital inflows into Bitcoin have accelerated recently based on the trend in the cryptocurrency’s Realized Cap.
The “Realized Cap” here refers to an on-chain capitalization model for BTC that calculates the asset’s total value by assuming that the ‘real’ value of each coin in circulation is the price at which it was last transacted on the network. This previous transfer of any coin is likely to be the last point at which it changed hands, so the price at its time could be considered as its current cost basis. As such, the Realized Cap is a sum of the cost basis of all coins in circulation.
One way to look at the model, therefore, is as a measure of the total amount of capital that the investors have put into the cryptocurrency. In contrast, the usual market cap, which calculates the total value of the BTC supply at the current spot price, represents the value that the holders are carrying right now.
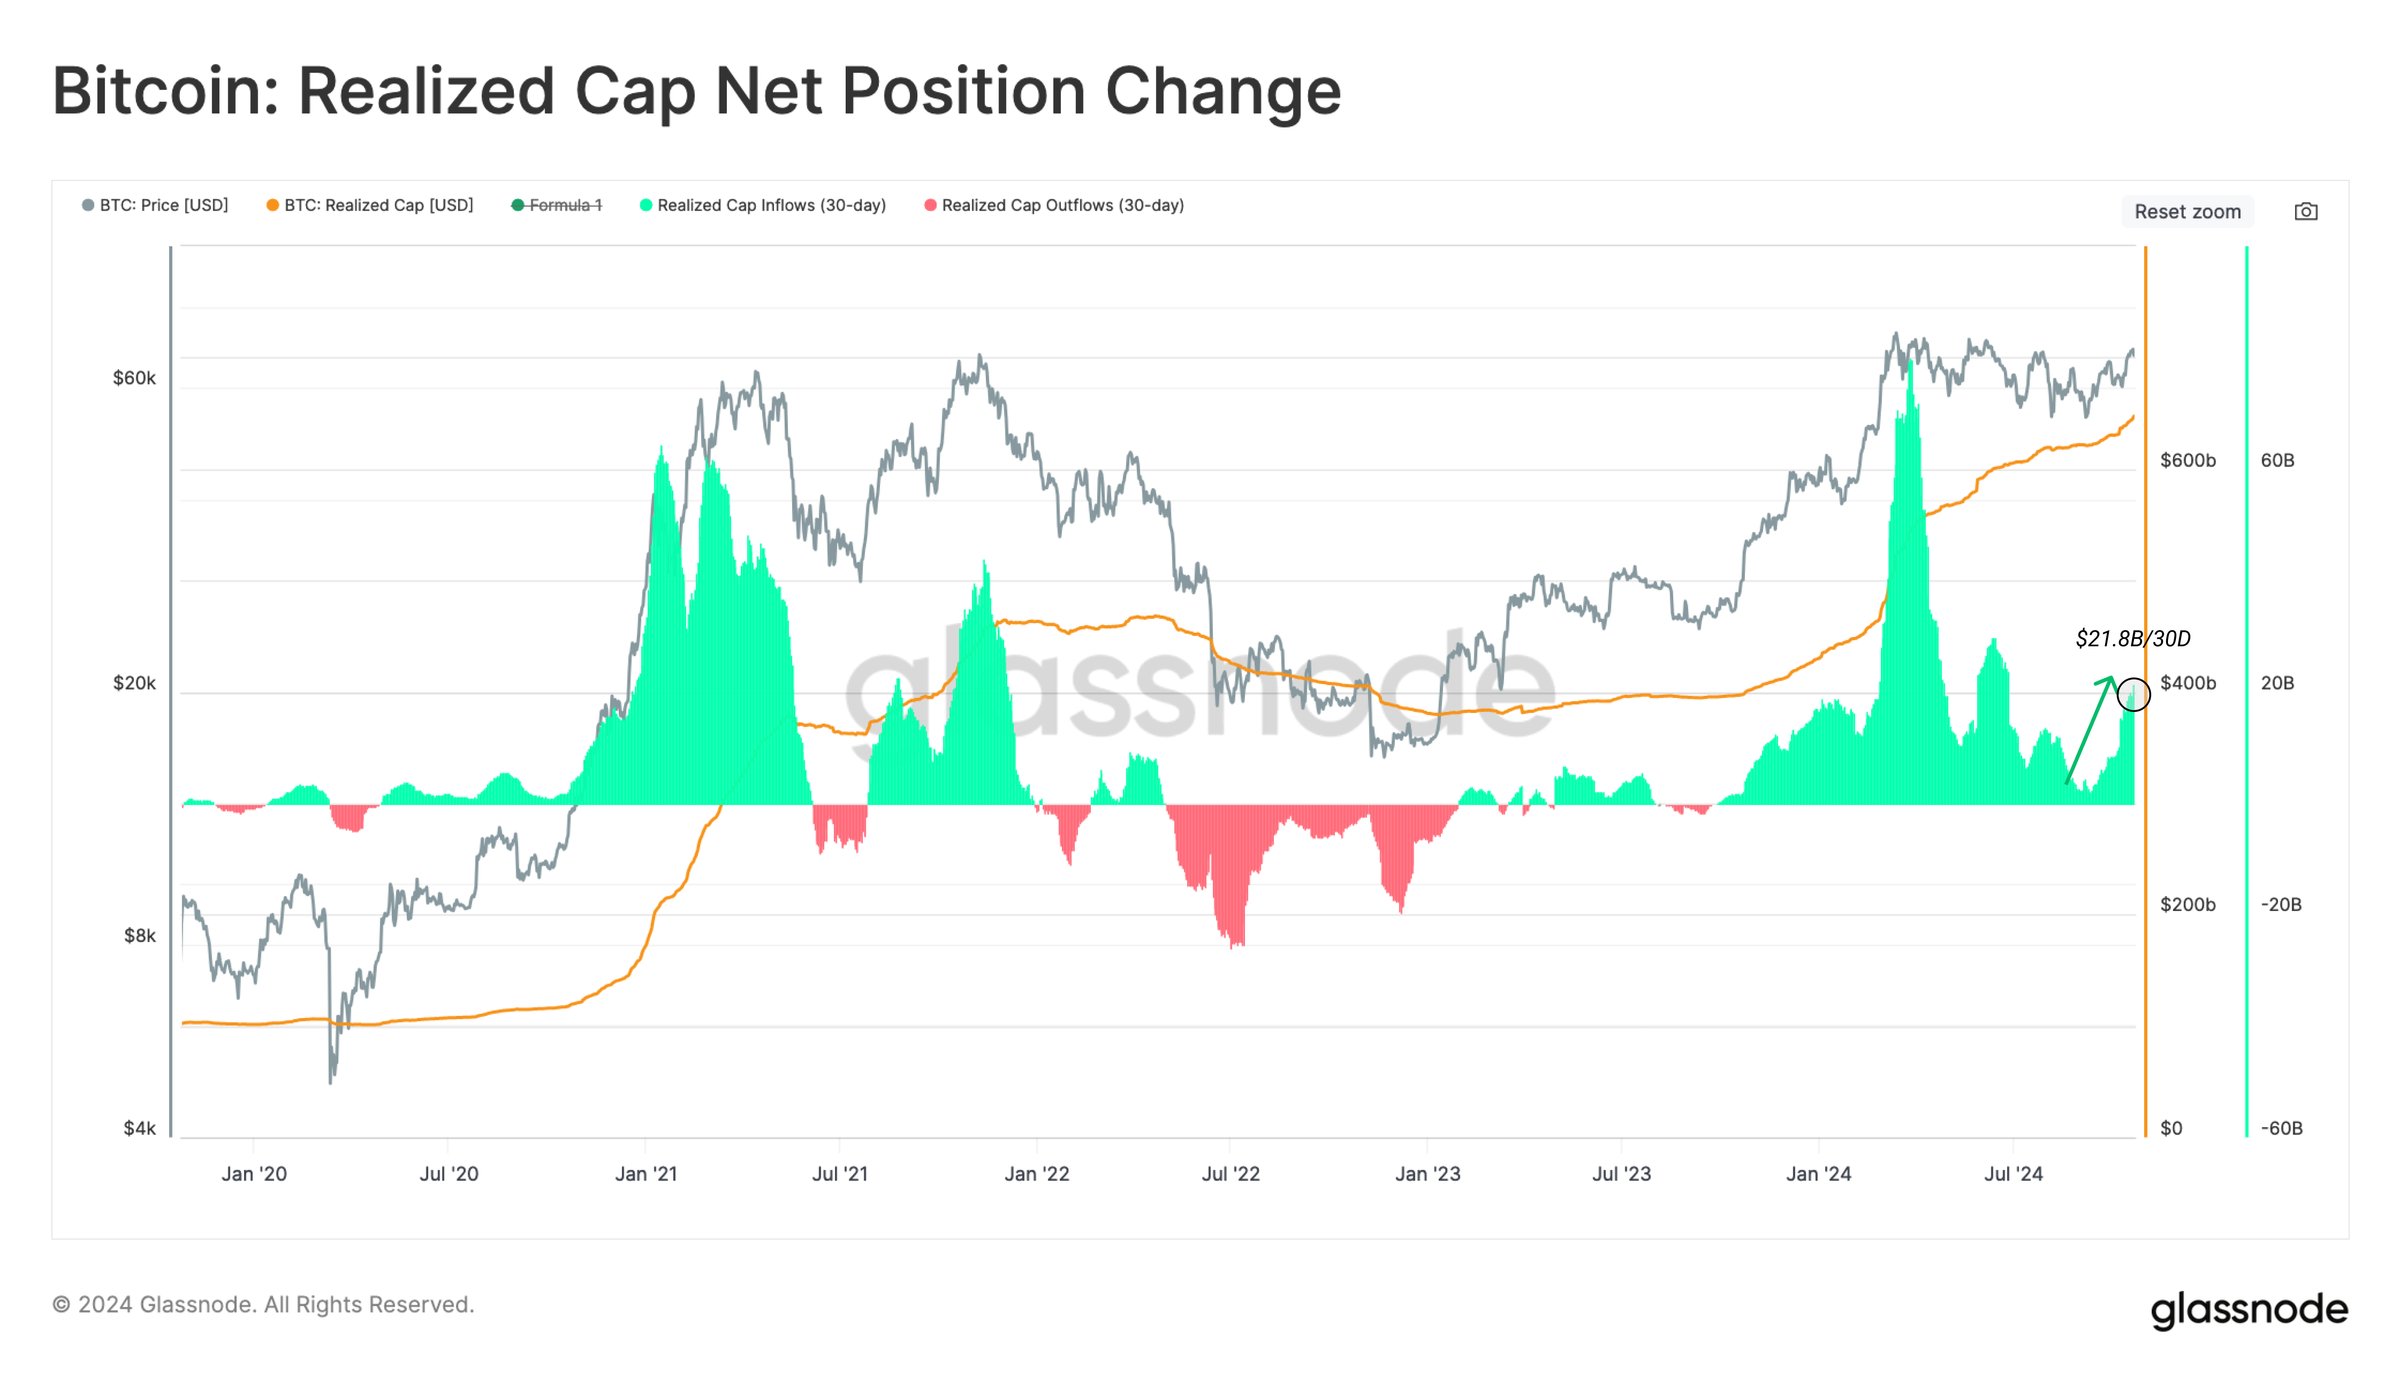
Now, here is the chart shared by Glassnode that shows the trend in the Bitcoin Realized Cap and its 30-day change over the past few years:
From the graph, it’s visible that the Bitcoin Realized Cap has been almost entirely observing positive growth since early 2023 as the metric’s 30-day net change has remained green.
The indicator’s increase was slow for much of last year, but it started to ramp up once 2024 approached. And in the first quarter of this year, the metric set a new record as its 30-day change reached positive levels surpassing the 2021 bull run highs.
As the Realized Cap represents the amount the investors as a whole have invested, the 30-day change in its value reflects the capital flows moving in or out of the asset. It’s apparent from the chart that BTC’s ATH earlier in the year coincided with the peak inflows into the coin.
During the asset’s consolidation that followed the high, though, the demand became muted, with the Realized Cap witnessing a slowdown. The trend has finally shifted again recently, as the 30-day net change in the metric has once more surged.
Over the past month, the indicator has grown by around $21.8 billion, which has taken it to a new record of over $646 billion. Glassnode has noted this suggests “liquidity across the asset class is rising, & meaningful capital inflows support the price increase.”
BTC Price
Despite the sharp capital inflows, the Bitcoin rally has hit a pause as the coin’s price is still trading around $68,000.


