The Bitcoin Chart Wall Street Doesn’t Want You To See
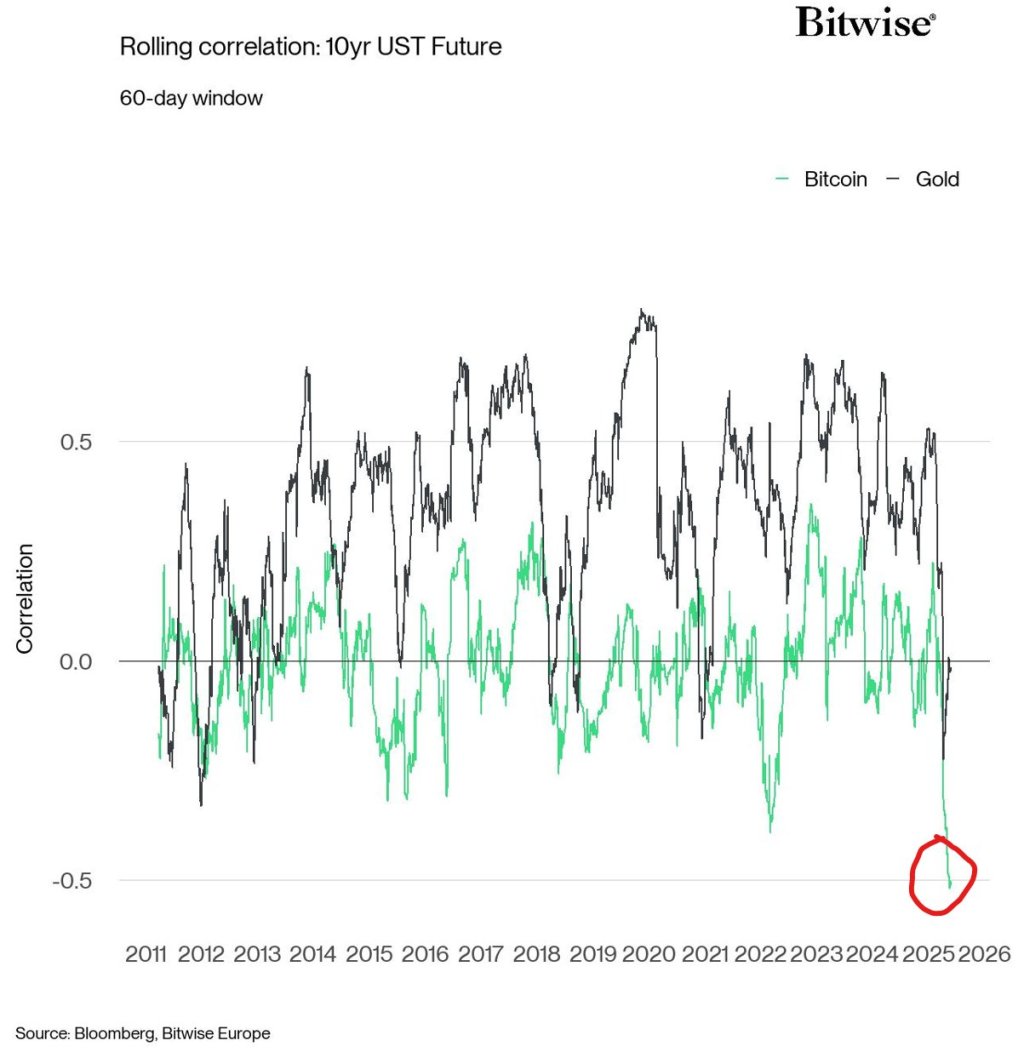
A single data series is up-ending decades of portfolio theory. On 29 May, André Dragosch, PhD, European head of research at Bitwise, posted a chart showing that the 60-day rolling correlation between Bitcoin and 10-year US Treasury-bond futures has collapsed to its most negative reading on record.
Bitcoin Vs. 10-Year US Treasury Futures
“This is probably the most important macro chart for bitcoin right now… Bitcoin’s 60-day correlation to US 10yr Treasury Futures has declined to the lowest level ON RECORD. Are traditional investors selling US Treasuries to buy Bitcoin?” he wrote, framing the plunge as a watershed moment for asset allocation.
Dragosch’s follow-up thread sharpened the point. “US Treasuries are broken; there has been a structural break in inter-market correlations since at least 2022… Bitcoin is an alternative portfolio insurance against sovereign default as a counterparty-risk-free asset… Foreign investors have been moving away from US Treasuries into hard assets like gold and apparently bitcoin more recently… Comparing Bitcoin’s market cap to gold only is an obsolete view—Bitcoin is increasingly competing with sovereign bonds as an alternative store of value.”
The structural cracks he cites are real. Bitwise’s March “Macro Fault Line” report documented the deepest bear market in long-duration Treasuries in modern history—more than a 40 percent drawdown—alongside yawning deviations in once-stable correlations between bonds, commodities and foreign yields. The research pinned the shift on post-2022 inflation shocks, swelling fiscal deficits and an exodus of foreign reserve managers from US debt.
BTC Exposes The Cracks In The System
Bloomberg’s Asia wealth survey last week confirmed the migration: high-net-worth clients, once über-long dollar paper, are rotating into gold, Chinese assets and crypto, while China and other large holders keep trimming Treasury positions in favour of alternative reserves. At the same time, the term premium on the 10-year note—normally a cushion for bond investors—has failed to rise in step with deficits, hinting at latent liquidity risk.
Bitcoin has caught that bid US spot-Bitcoin ETFs drew a record net $6.35 billion in May, lifting BlackRock’s IBIT alone to $71 billion in assets under management. Those flows arrived even as Treasury auctions stumbled, with a 20-year bond pricing above the when-issued yield and pushing investors to demand still higher compensation for duration risk.
Correlations back up Dragosch’s thesis. Bitwise data show BTC’s link to Treasuries is now far weaker than gold’s, yet the cryptocurrency has historically outperformed bullion on days when bond prices fall sharply, underscoring its appeal as “portfolio insurance” in a sovereign-debt drawdown.
None of this guarantees a one-way trade. Bitwise itself warns that tighter financial conditions can still buffet crypto prices, and BTC retains a meaningful connection to risk assets during acute equity sell-offs. But the direction of travel in sovereign debt is forcing investors to look elsewhere for something that cannot default or be debased. As Dragosch put it, “We are going way, way higher.”
For traditional portfolio managers whose models still anchor on a positive Treasury hedge, the chart Wall Street “doesn’t want you to see” is more than a curiosity—it is a sign that the 60/40 paradigm is splintering. The longer bond markets struggle to fulfil their historic safe-haven role, the louder Bitcoin’s pitch as digital, bearer-asset insurance is likely to become.
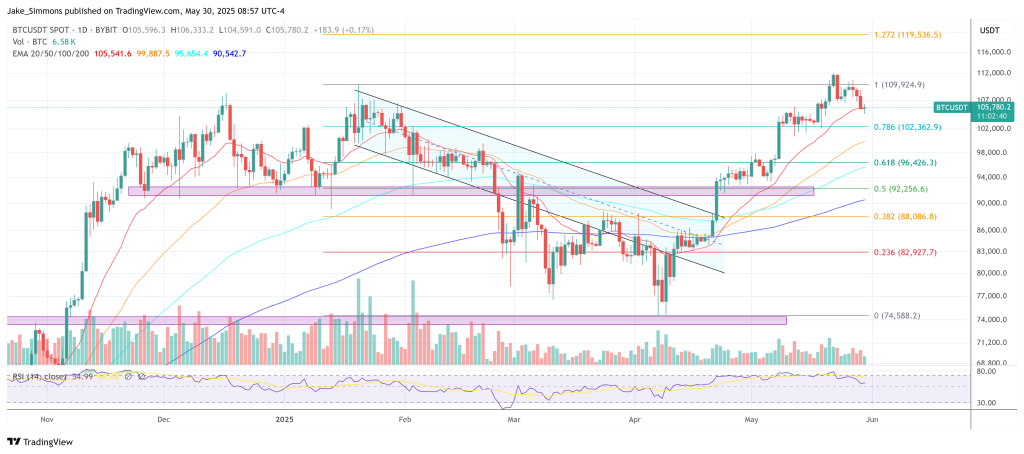
At press time, BTC traded at $105,780.