Bitcoin Bulls Should Be Wary as Dollar Index Chart Flashes ‘Death Cross’: Technical Analysis
This is a daily technical analysis by CoinDesk analyst and Chartered Market Technician Omkar Godbole.
Bitcoin (BTC) bulls are optimistic that the U.S. dollar’s broader sell-off will continue in the second half of the year, fueling the crypto bull run.
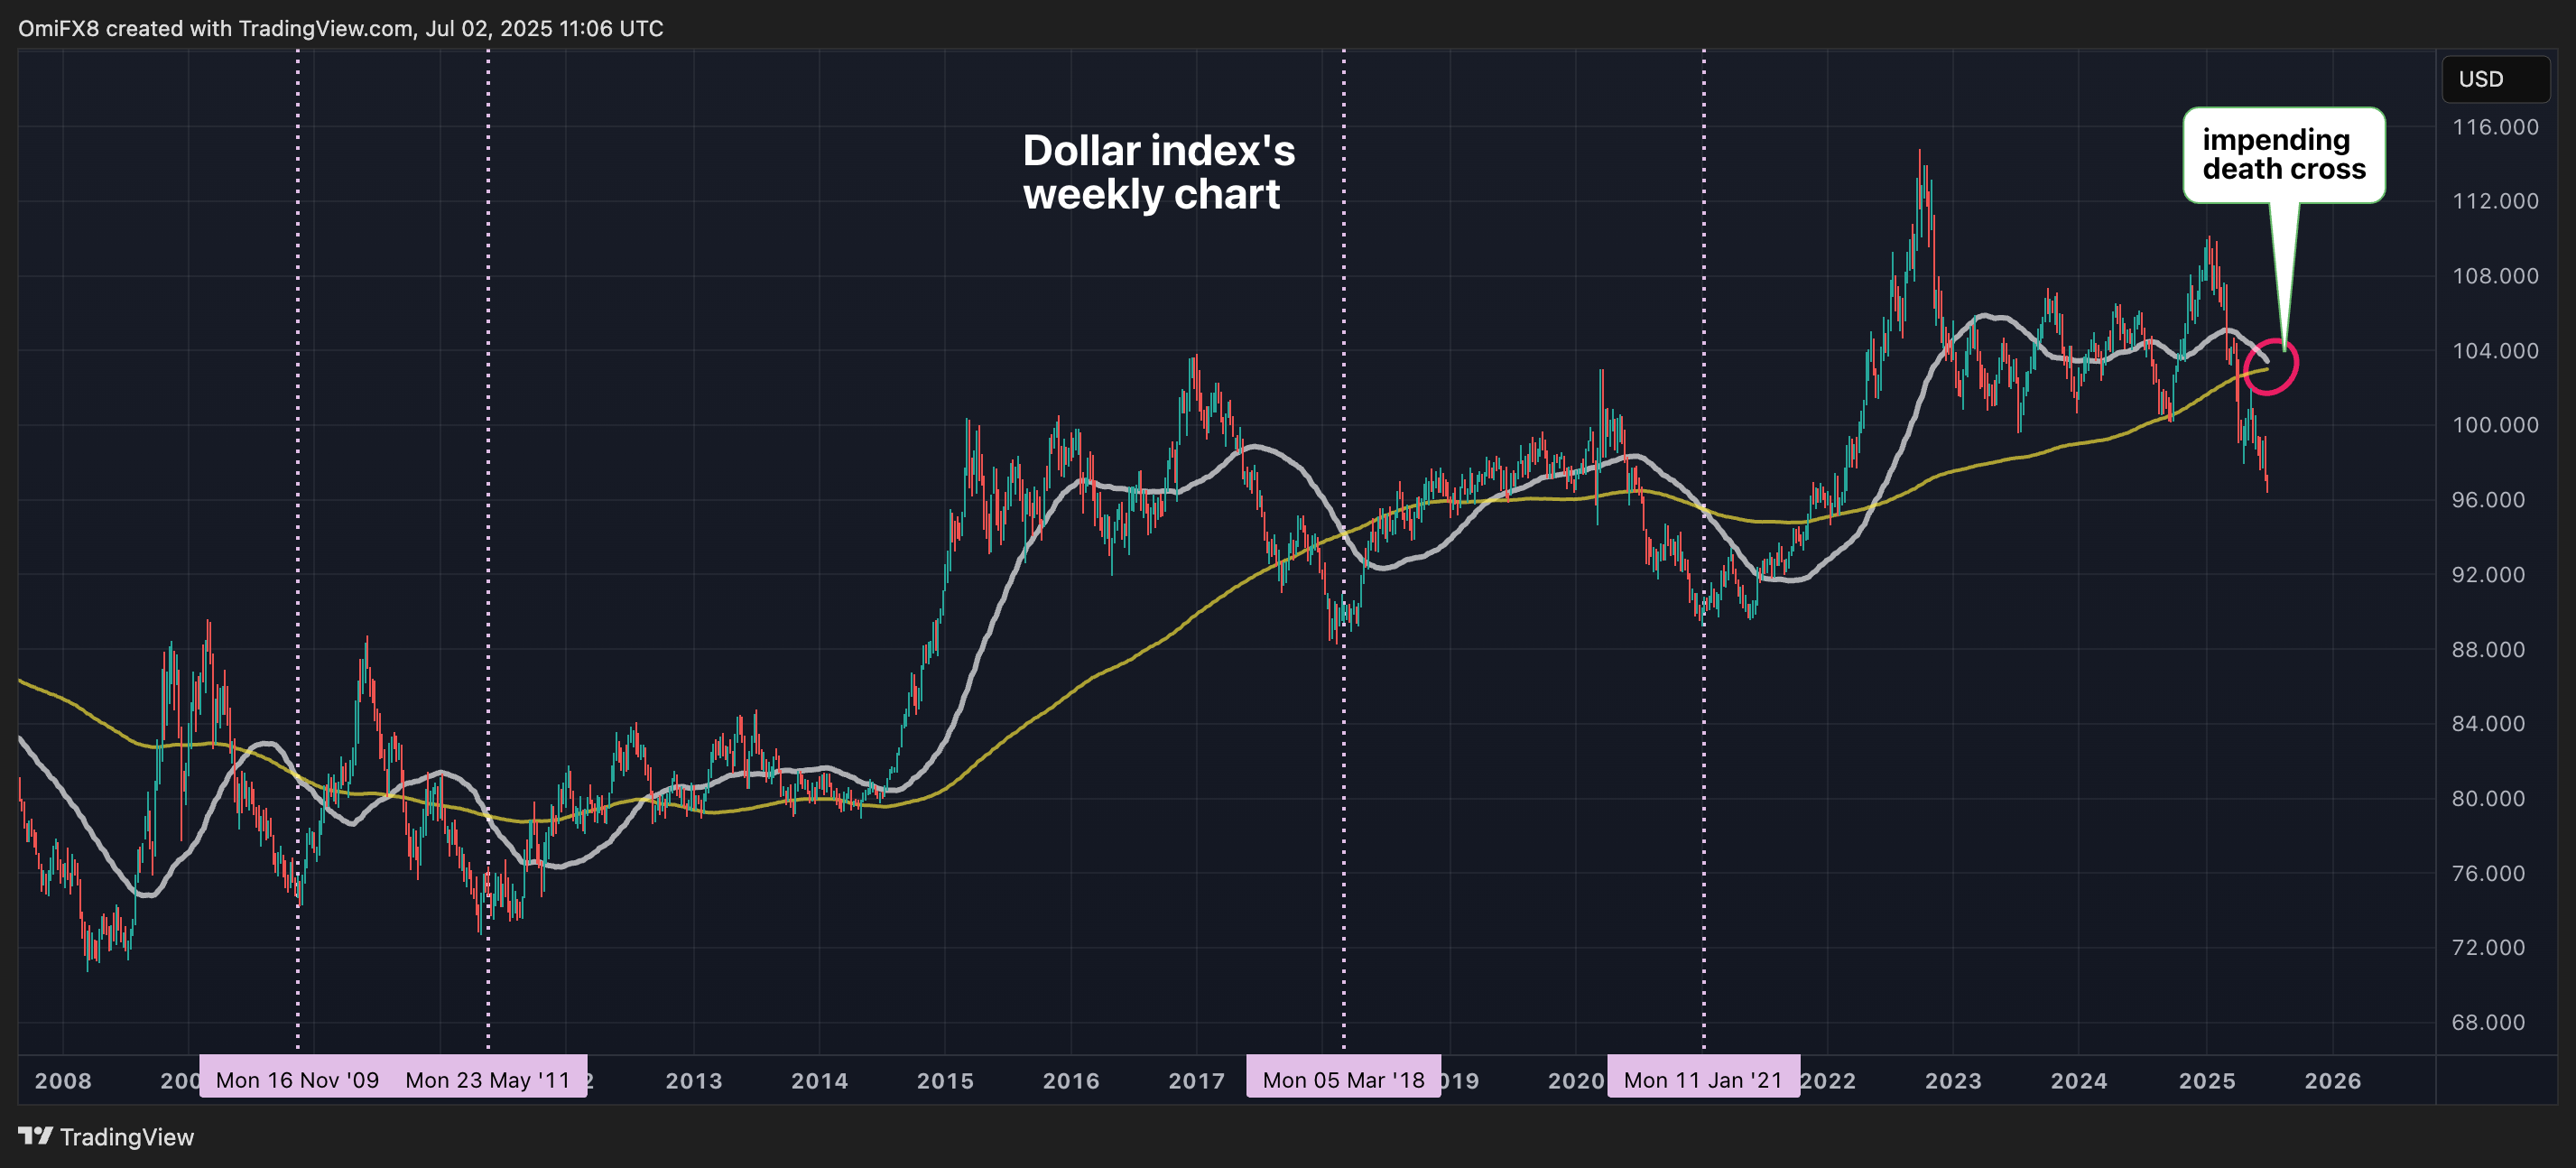
However, one chart warrants caution when relying on bearish dollar predictions. That’s the dollar index’s weekly chart, which shows the 50-week simple moving average (SMA) is on track to cross below the 200-week SMA in the near term, forming the notorious death cross.
While the ominous-sounding pattern is widely regarded as a long-term bearish signal, historically, it has proven to be a bear trap, consistently marking bottoms and bullish trend reversals in the US dollar.
The chart below shows that DXY has chalked out four weekly chart death crosses since 2009, and each of those marked the end of downtrends (marked by vertical lines), setting the stage for sharp rallies.

The last one occurred in January 2021, marking the bottom at around 90. The dollar caught the bid in the subsequent months, with the index eventually hitting a high of over 114.00 in September 2022.
Note that price patterns do not always unfold as expected, meaning the impending death cross may not necessarily trap bears; however, being aware of its past tendency can help traders manage their positions more effectively.
The dollar index, which tracks the greenback’s value against major fiat currencies, tanked by 10.78% in the first half of the year, its worst performance since 1991.


