Strategy’s MSTR Plummets 7% To $300: What Does Technical Analysis Say?
Strategy (NASDAQ: MSTR) stock closed at $300.70 after sliding nearly 7% on Thursday, leaving the stock at one of the most critical points in its trading history.
Daily Chart Signals Breakdown Risk Below $300
The drop follows a multi-week downtrend as an anticipated recovery failed to take shape, pushing the price against a dense support cluster.
This zone has become both a technical floor and a psychological barrier, and its defense or failure could shape the stock’s direction for the rest of the year.
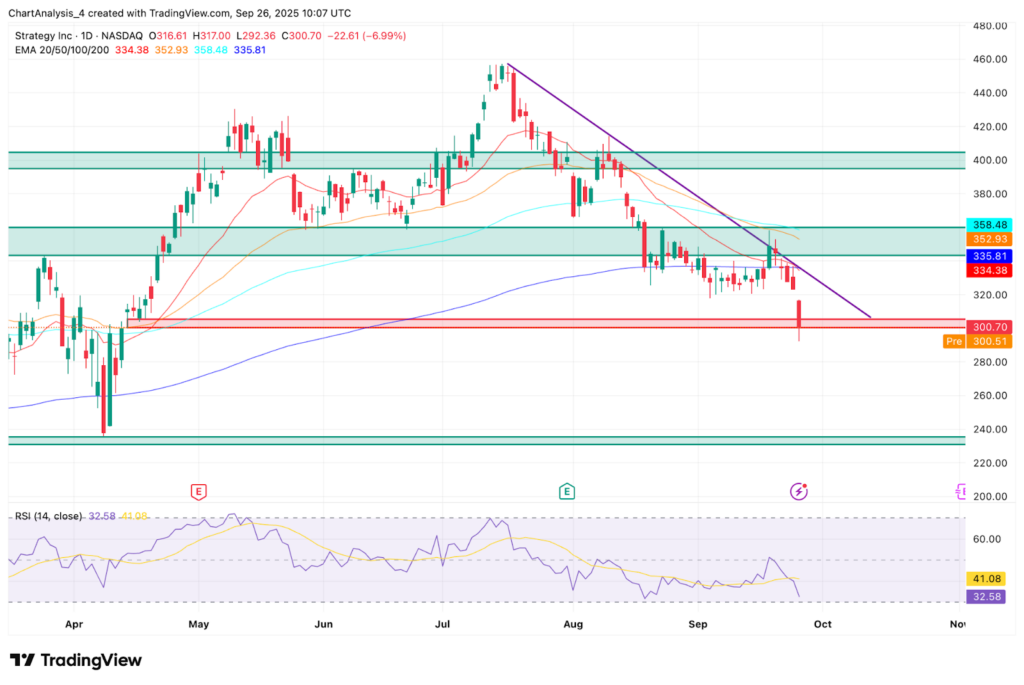
MSTR Key Technical Levels (Source: TradingView)
Technical analysis: On the daily timeframe, Strategy has fallen beneath the 20, 50, and 100-day EMAs, turning the 200-day EMA near $335 into overhead resistance.
The Relative Strength Index is holding near 32, signaling the stock is approaching oversold territory without yet confirming a reversal.
Market structure highlights the risks: a breakdown below $295–$300 could …


