Bitcoin Price Analysis Reveals Bearish Structure Shift?
Bitcoin has been a source of concern for the crypto community lately. The reason for that is most likely the large declines in altcoin prices at a time when they are supposed to be ripping. Sentiment on CT (Crypto Twitter) has switched multiple times from bearish to bullish over the past couple of weeks. Follow along and discover what our Bitcoin Price Analysis reveals about market structure.
BITCOIN – It really is this simple
pic.twitter.com/82diL4OAxl
— Northstar (@NorthstarCharts) November 10, 2025
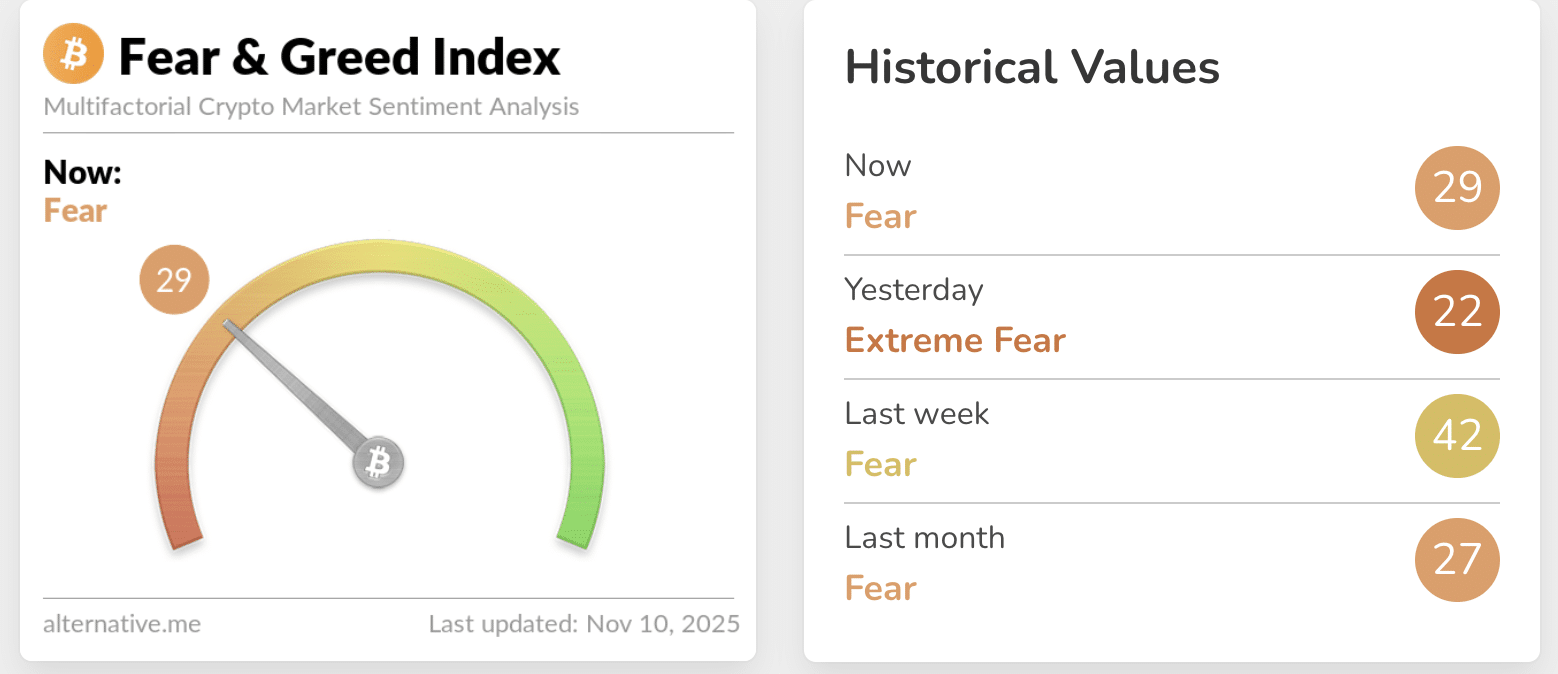
According to NorthstarCharts we are still in a bullish trend on the long-term timeframe, and actually sitting on support. Fear and green index show more fear than bears would like. Although this indicator is not decisive on its own. It appears that we have just revisited the 20 points for the first time since early 2025.

(Source – Alternative.me)
Bitcoin Price Analysis Could Hurt The Bulls

(Source – Tradingview, BTCUSD)
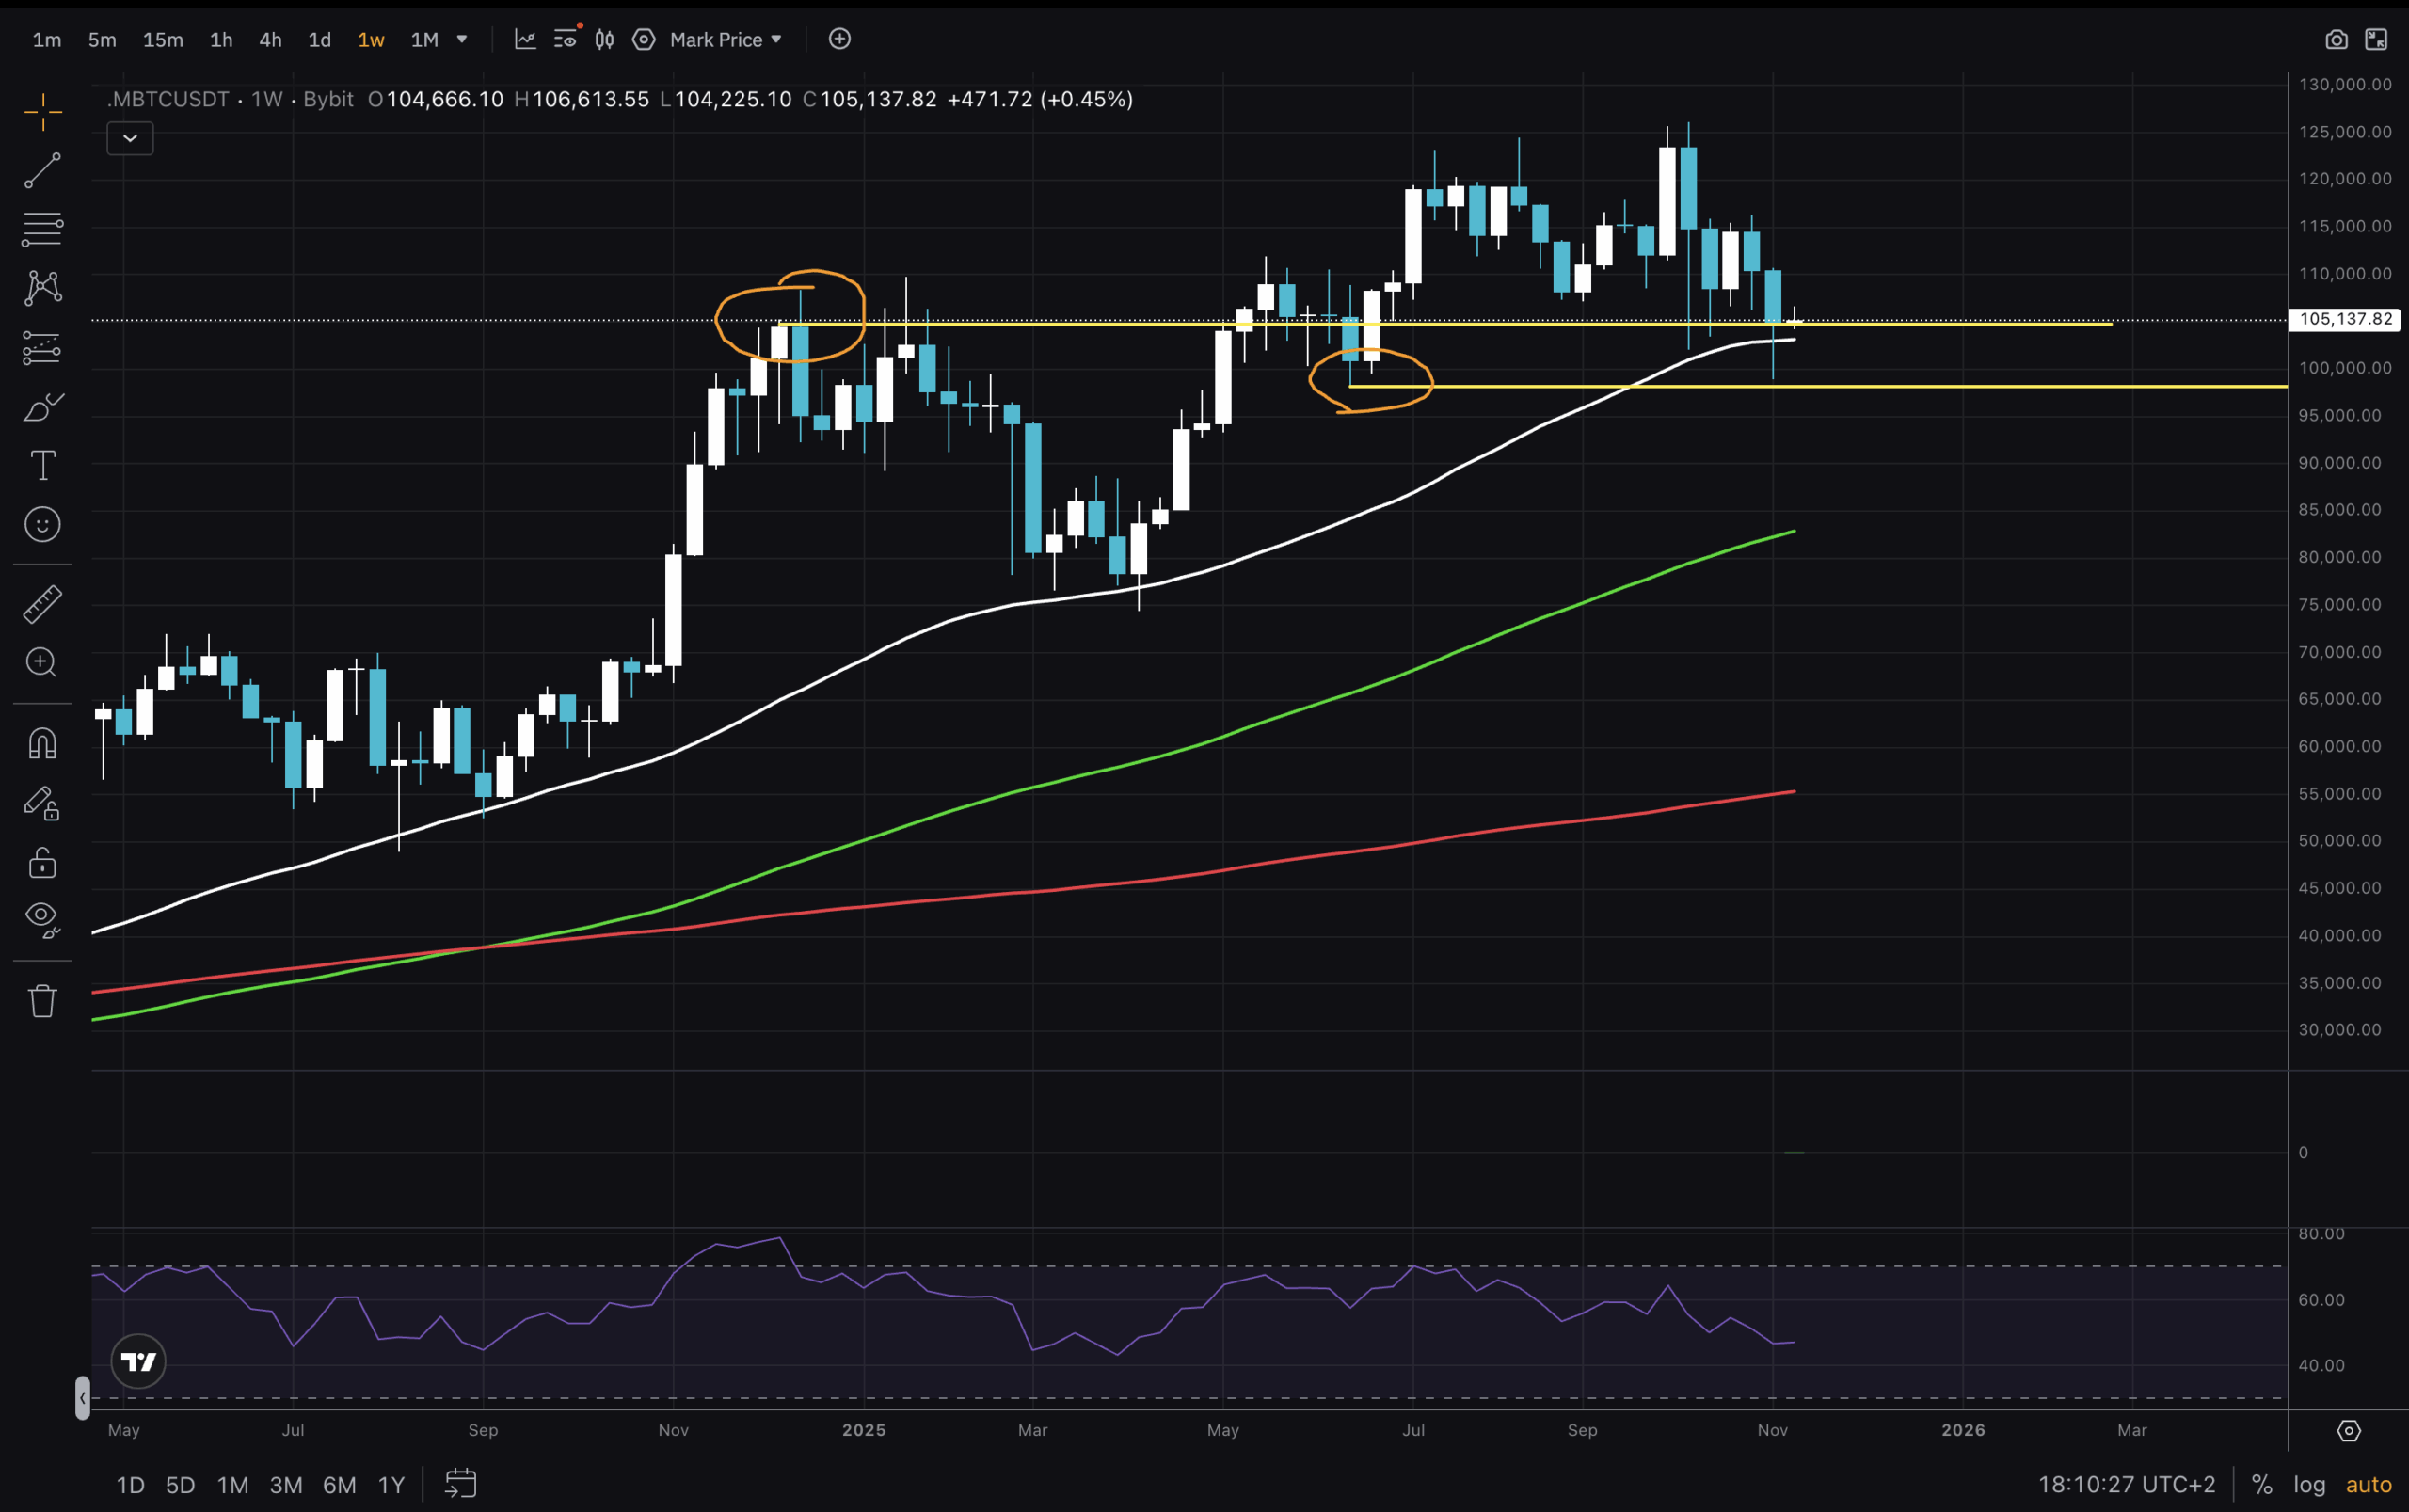
Starting our analysis on the Weekly chart, we can see the context in which the market is trading. The Bitcoin Price is sitting at the MA50 support, which provided the lows twice in the past year and a half. Additionally, it is trading within the zone defined by the high weekly candle close of Q4 2024 and the low from spring 2025. This $97,700 – $105,000 demand zone is currently acting as support.
DISCOVER: Best Meme Coin ICOs to Invest in 2025

(Source – Tradingview, BTCUSD)
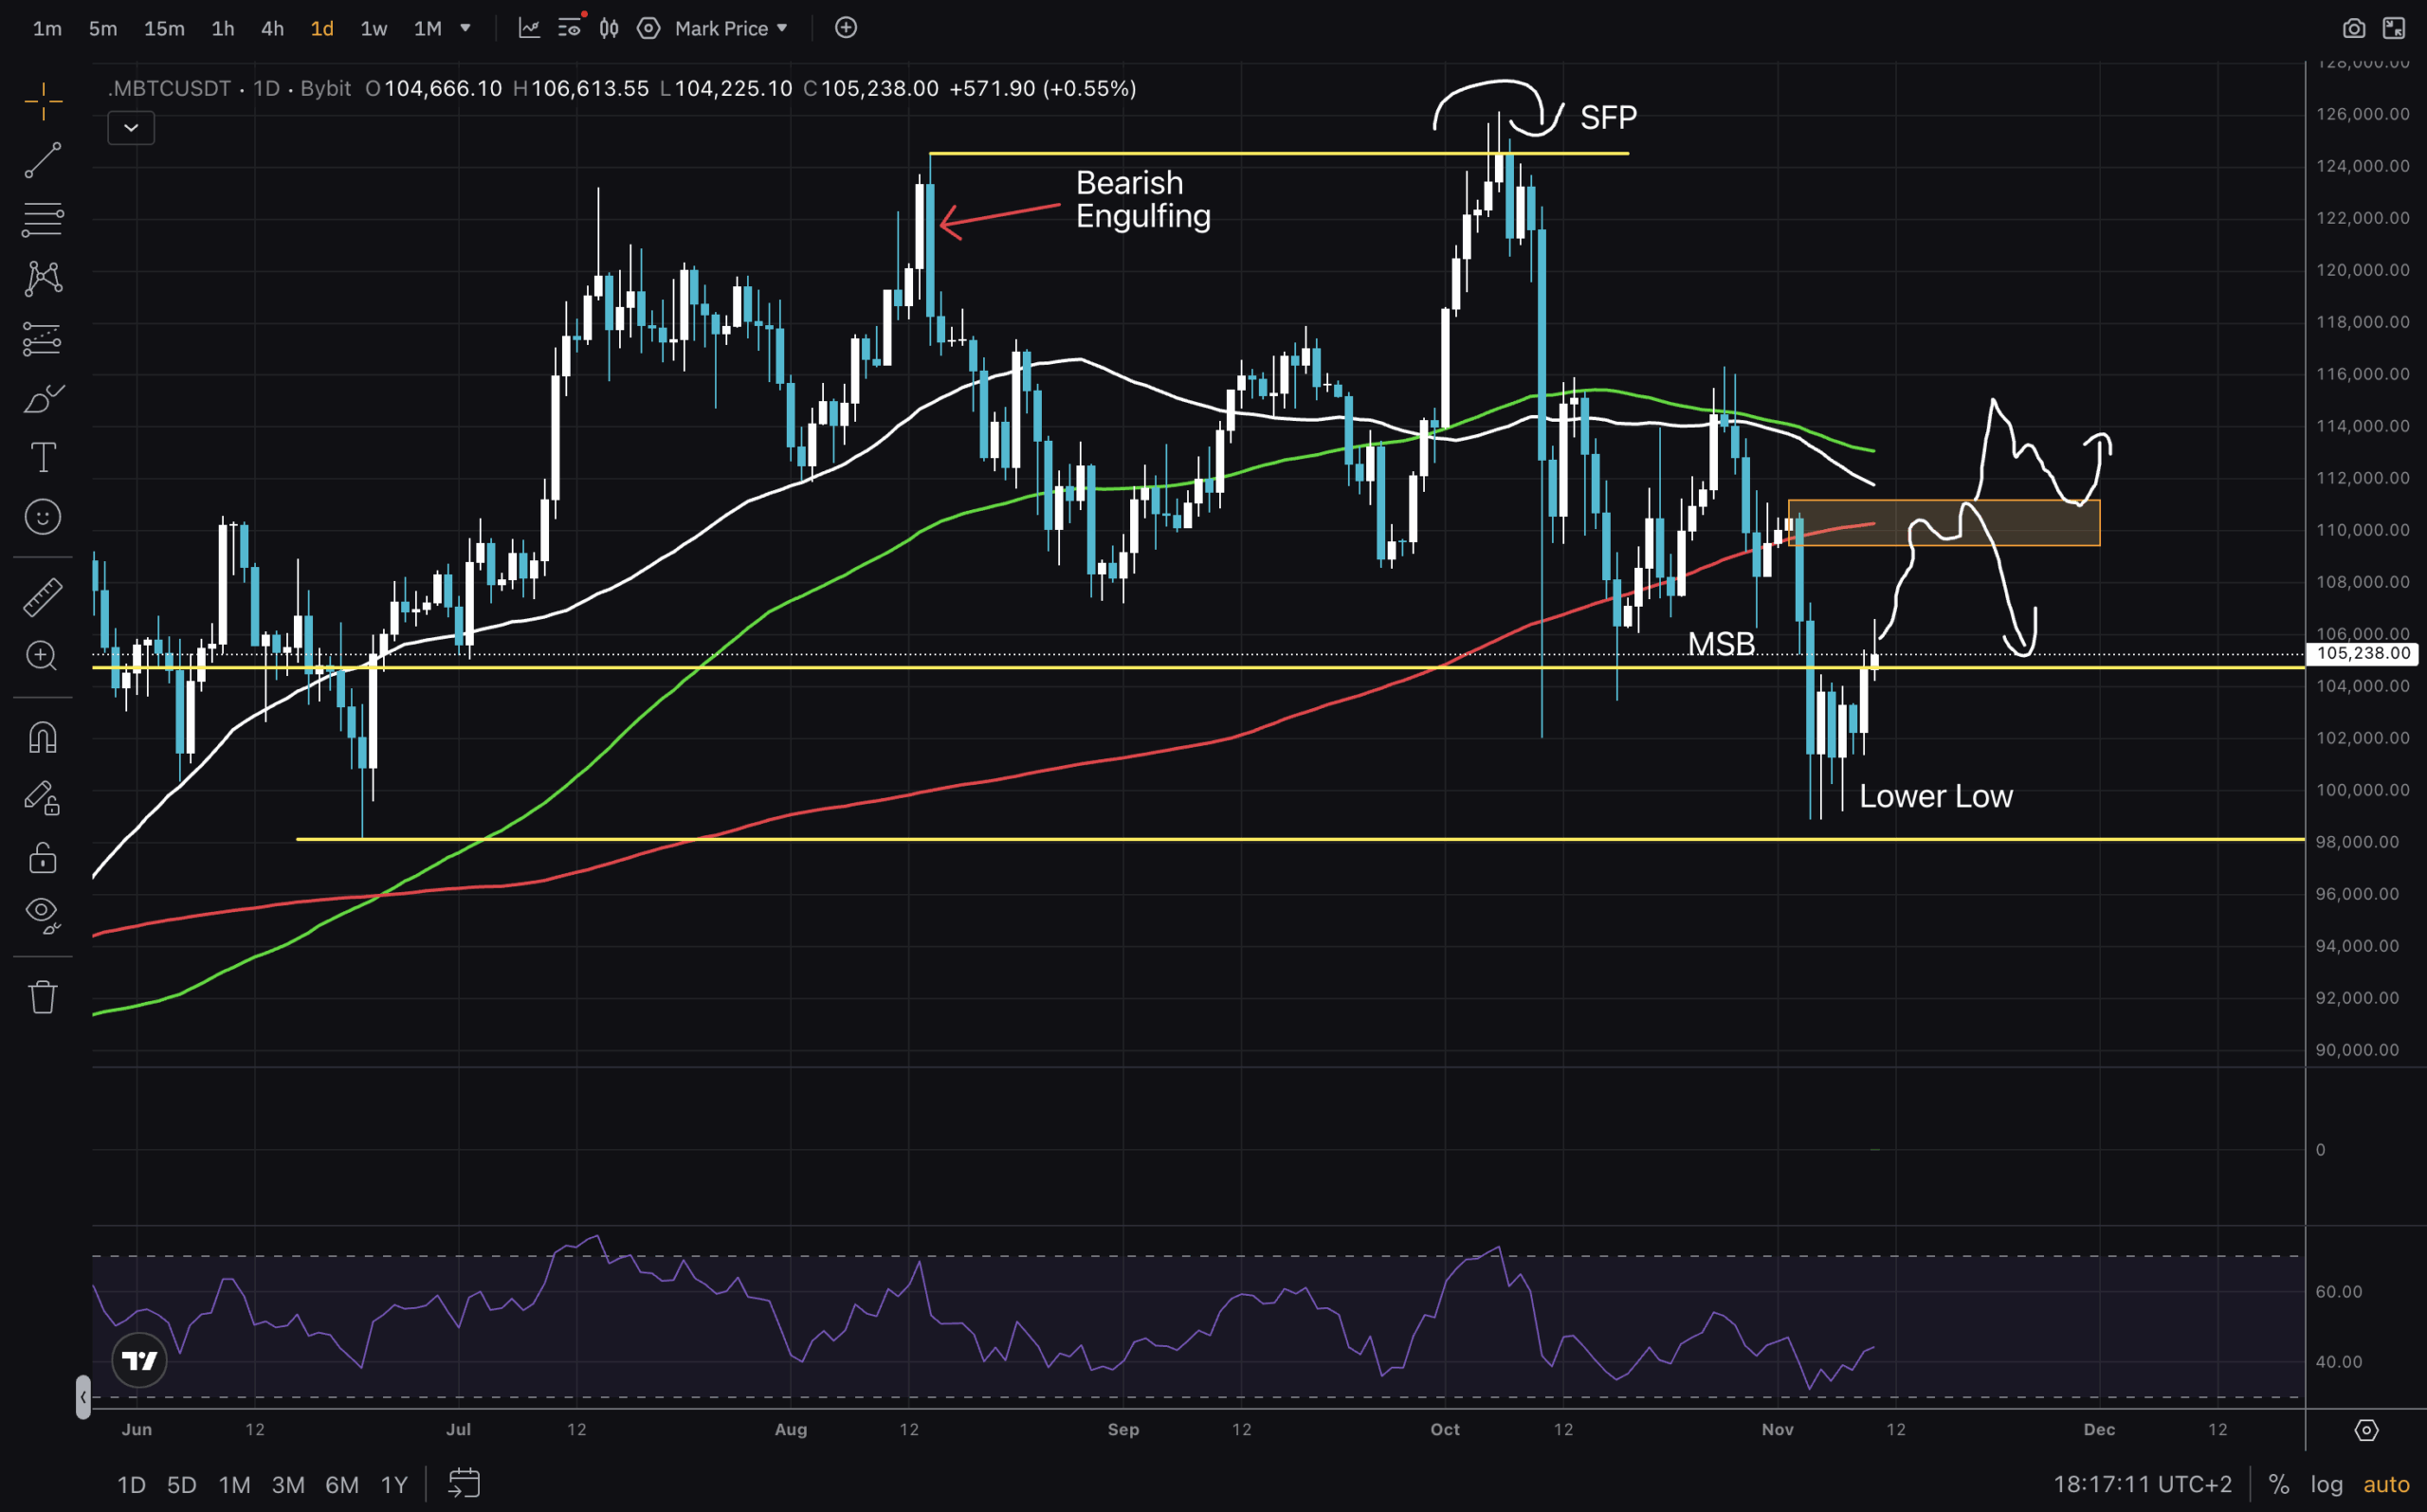
The Fear and Greed index experts say that buying when we are at Fear is a good DCA strategy. Being down low on that scale can turn this Lower Low on the Daily chart into a deviation. But bulls have a lot of work to put in. Two scenarios where this can be true are a continued push to the orange box, where it seems MAs will meet.
Then either a rejection and retest of $105,000 as support, or a push through the box and testing $110,000 for support. Now that RSI is at a low level, there is sufficient room for a price push.
DISCOVER: Top Solana Meme Coins to Buy in 2025
What Is Bitcoin Doing On The Short Timeframes?

(Source – Tradingview, BTCUSD)
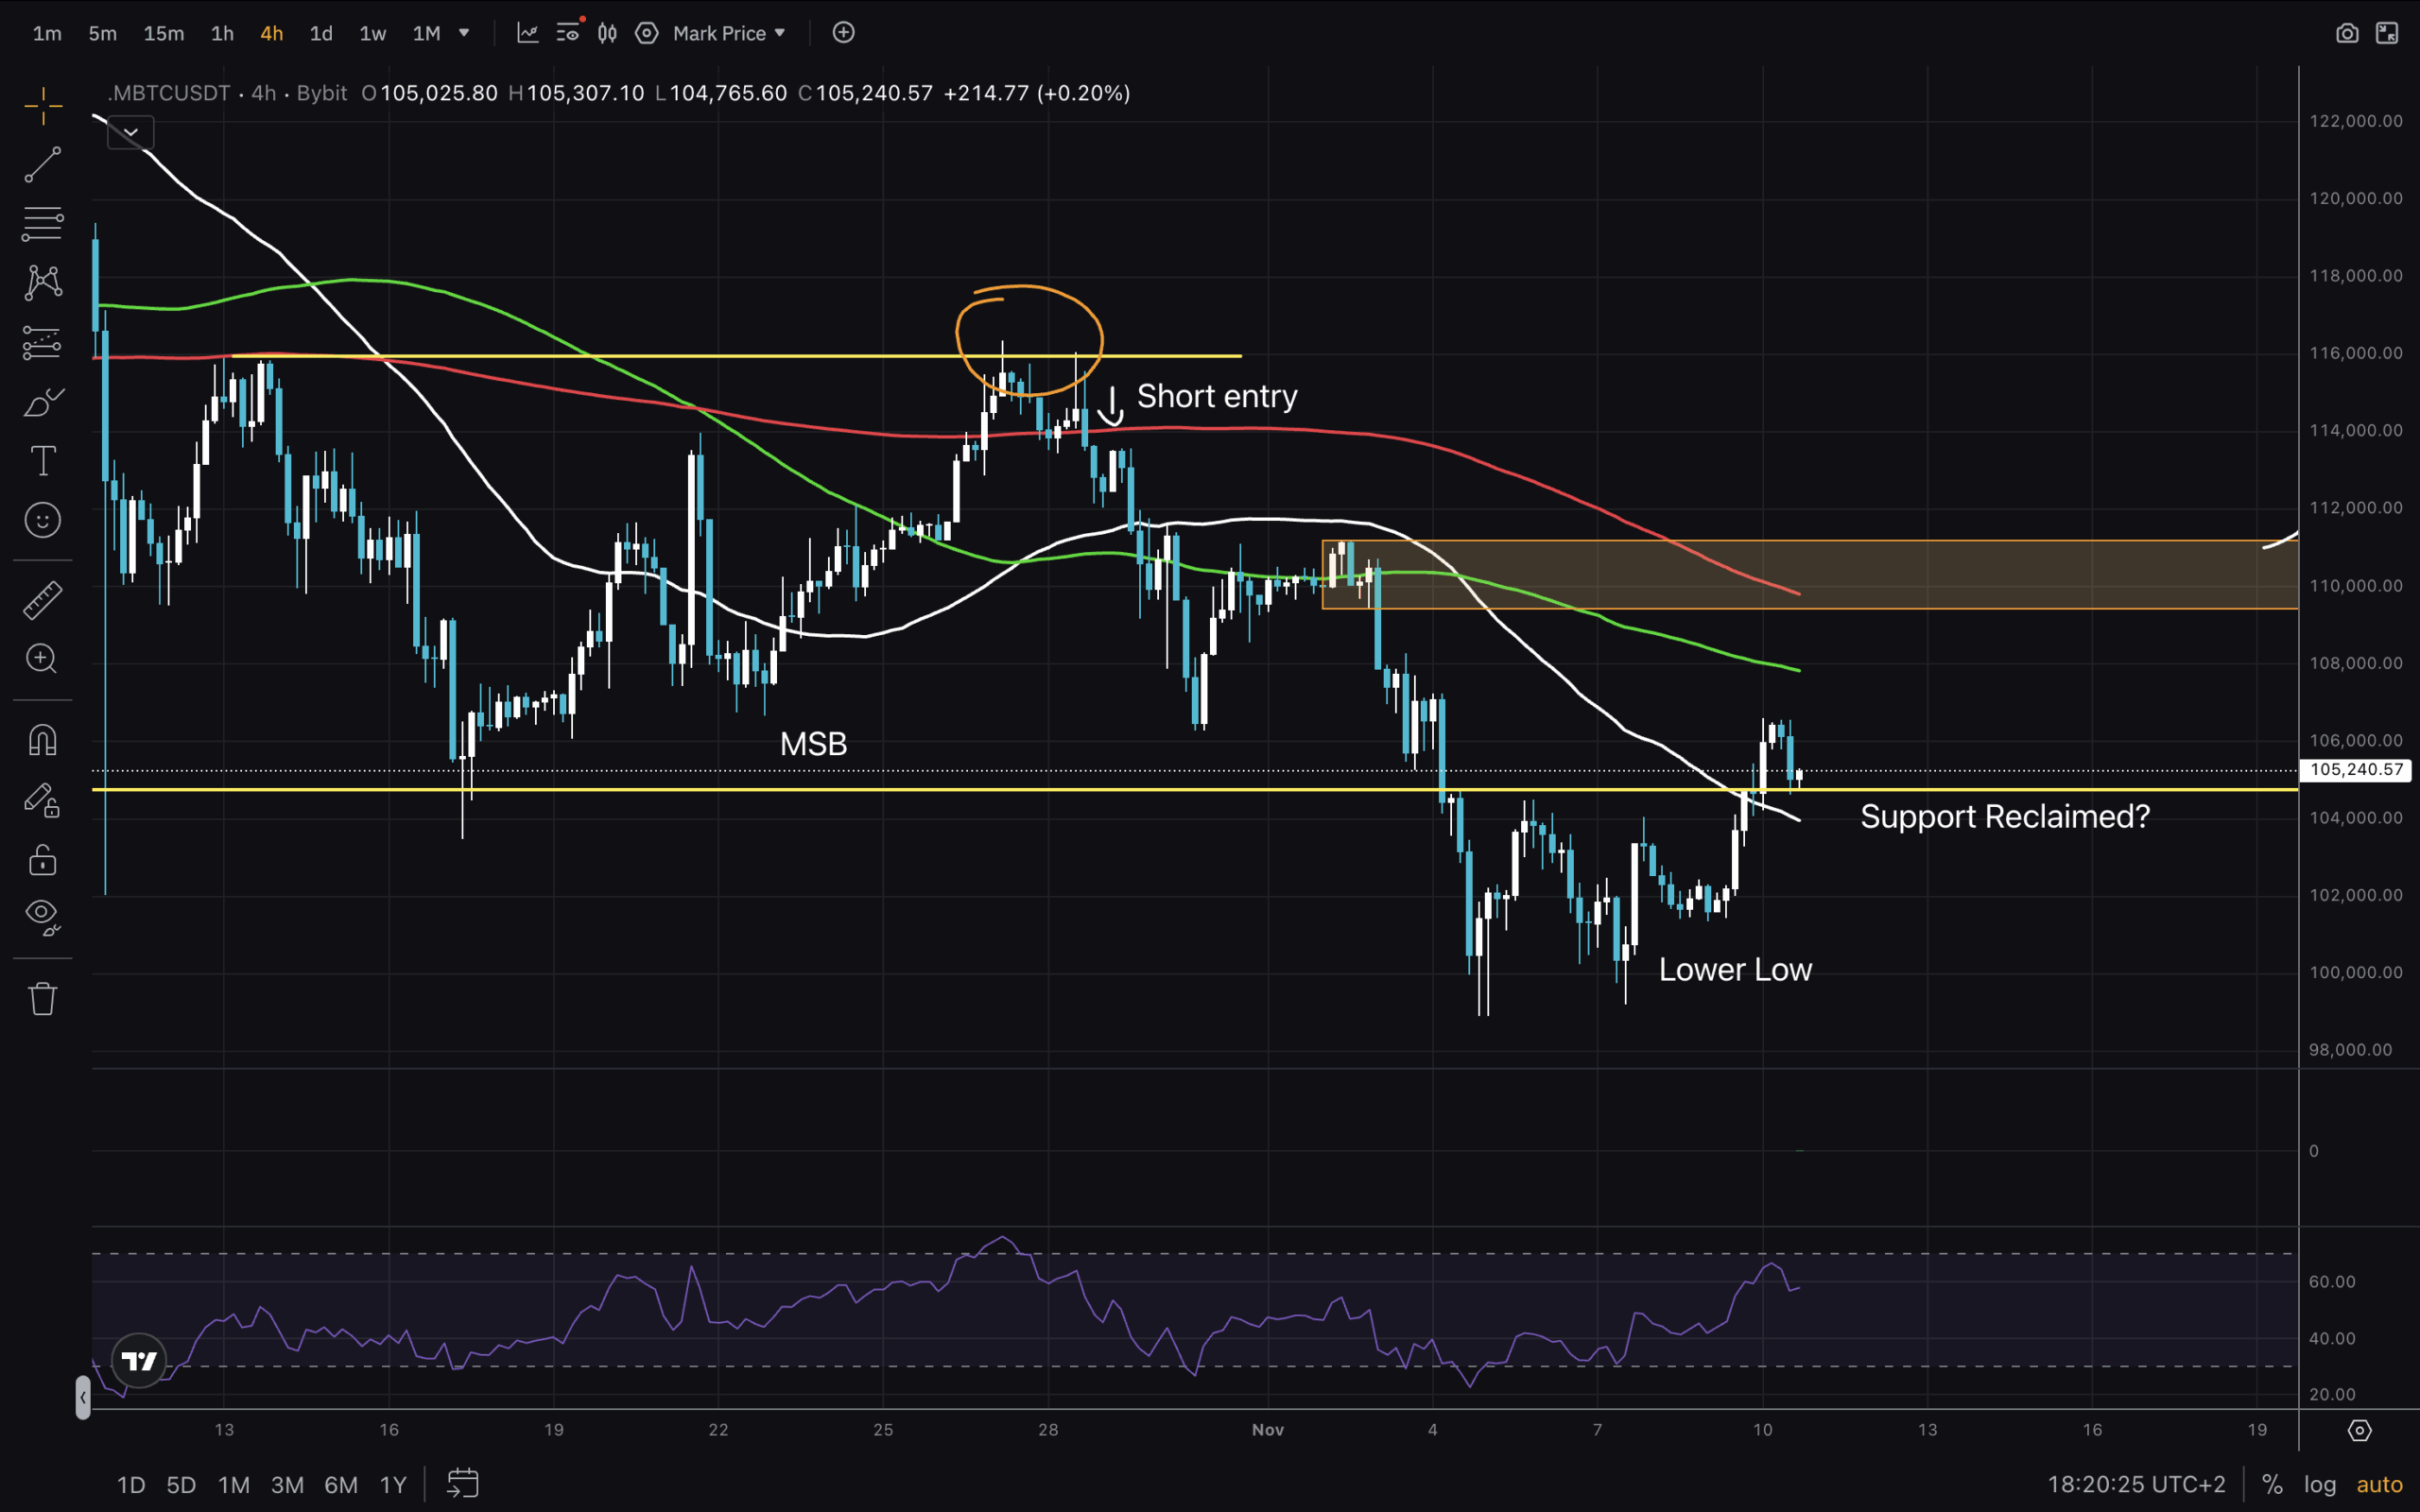
For traders, it is important to know how to trade in both directions of the market. On this 4H chart, we can see a great setup for a short. I marked the high formed after the SFP. Once the $116,000 level was rejected and the price dropped below the MA200 again, that was our trigger. Entry at ~112,500 with a stop at $116,000. Easy 2R until the $105,000 support and a 3R+ trade down to the Lower Low.
Now, for bulls, the hope is that this $105,000 is indeed reclaimed. Next resistance would be the MA100 and MA200. If we return to the range, there is still hope. If not, we continue this correction.
Happy trading and stay safe out there!
DISCOVER: Top 20 Crypto to Buy in 2025
Join The 99Bitcoins News Discord Here For The Latest Market Updates
Bitcoin Price Analysis Reveals Bearish Structure Shift?
- RSI on Daily has space to grow now.
- 4H chart shows bearish factors, with an MSB.
- If $105,000 reclaim is solid, a move to $110,00 can be expected
- Currently in bearish structure on Daily
- Still in bullish structure on Weekly
The post Bitcoin Price Analysis Reveals Bearish Structure Shift? appeared first on 99Bitcoins.


