Bitcoin’s $100K Breakdown Is A Liquidity Alarm For The Whole Market
Bitcoin didn’t just break below $100,000 this month; it flashed a systemic liquidity warning that equity and credit traders are already reacting to.
While most of the attention stayed on whether the AI trade had finally gone too far, the more interesting move was happening somewhere else: in subprime auto defaults, regional bank funding lines, and margin calls in leveraged crypto positions.
Earlier in November, Bitcoin (CRYPTO: BTC) slipped under the psychologically important $100,000 mark for the first time since May, touched an intraday low just below that level, then recovered only slightly. Around the same time, Coinbase dropped nearly 7 percent in a single session and now trades well below its 50-day moving average.
Three different markets. One signal: liquidity is getting tighter.
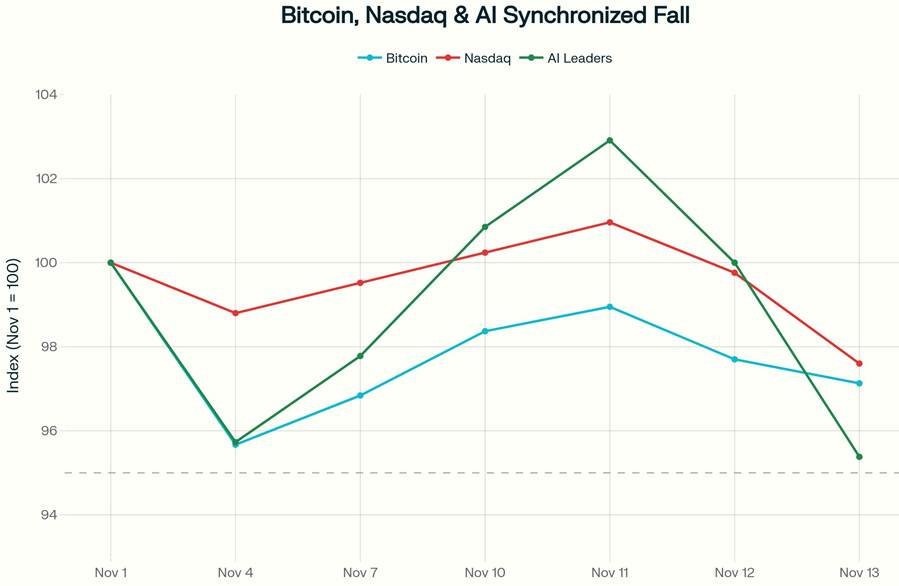
Bitcoin, Nasdaq & AI Leaders Show Synchronized Decline: From Nov 1-13, 2025, all three asset classes fell together, with Bitcoin breaking below $100K while tech indices retreated. Normalized to 100 on Nov 1 for direct comparison. This cross-asset correlation signals a liquidity squeeze, not isolated crypto weakness
Bitcoin Is Trading Like a Liquidity Guage, Not a Market Movement
For years, Bitcoin has been marketed as a hedge against inflation, politics, and even systemic risk. On days like this, it behaves much more like a high-beta barometer of global liquidity.
The recent move below $100,000 wasn’t a slow grind driven by weak fundamentals. It was a deleveraging event:
- Leveraged long positions were forced out as margin calls hit and liquidations rolled through derivatives venues.
- ETF outflows and short term traders selling into weakness made the fall steeper.
- Order books were thin enough that each round of selling knocked through bids faster than in a calm market.
The result is that the 100,000 to 101,000 area has turned into an important short term support band, while the 104,000 to 105,000 region has acted as a ceiling that buyers have not been able to clear.
Long term holders, though, have not dumped their coins. On chain data suggests that the most committed wallets are largely sitting tight. That points to stress at the margin, where borrowed money and short term leverage live, rather than a collapse in long term belief.
For traders, that is the tell. When an asset that is closely tied to speculative capital breaks a key level on forced selling, it usually marks the first place a broader liquidity squeeze shows up.
The Quiet Credit Squeeze Behind the Move
If you step away from the Bitcoin chart, the backdrop looks even more worrisome.
Over the past couple of months, the United States has seen a run of credit market problems that do not fit neatly into the AI narrative. A major subprime auto lender, Tricolor Holdings, filed for bankruptcy and forced write downs at big banks such as JPMorgan Chase and Fifth Third. Losses and fraud related issues have also surfaced at regional lenders including First Citizens, Zions, and Western Alliance.
At the same time, some regional banks have started relying more on the Federal Reserve’s short term liquidity backstops, drawing on facilities and repo lines that are designed for periods of stress rather than routine pullbacks. Even without obsessing over weekly usage data, the simple fact that banks are paying up for extra funding tells you something about the mood on their balance sheets.
Credit rating agencies are picking up similar signals in private credit. DBRS Morningstar and others have highlighted that downgrades in several pockets of private debt are now outpacing upgrades. Goldman Sachs Research still argues that recent defaults are not yet systemic, but it has …


