ETH USD Is Trapped: Ethereum Price Prediction Sounds Alarm on Bear Channel
That’s it. I’m done. I’m done with crypto. Lamest bull market of my life.
0.69%
Bitcoin
BTC
Price
$95,736.88
0.69% /24h
Volume in 24h
$59.89B
Price 7d
didn’t even make it to 150k. Tom Lee’s Ethereum price prediction was wrong, and ETH made a new ATH for all of two seconds. There was no alt season.
And the only coins that did anything notable were flagrant casino 1000x tokens. Future of finance my ass.
RUMORS: CZ had posted:
“Tomorrow marks the first day of the bull run.
Today was the bottom.$BTC heading to $200,000 this year itself.”He deleted the post within 20 seconds. pic.twitter.com/Vy6T4fhkNX
— Wang 王
BNB (@wangbnbwhale) November 16, 2025
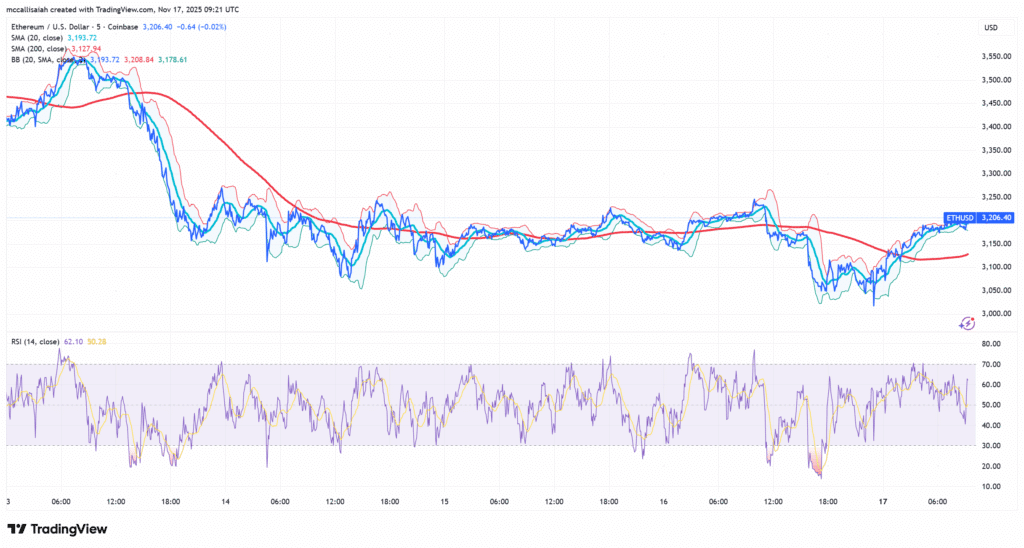
Meanwhile, Ether cracked below the $3,100 level for the first time since early November, slipping to $3,066 on Sunday during a broader crypto pullback.
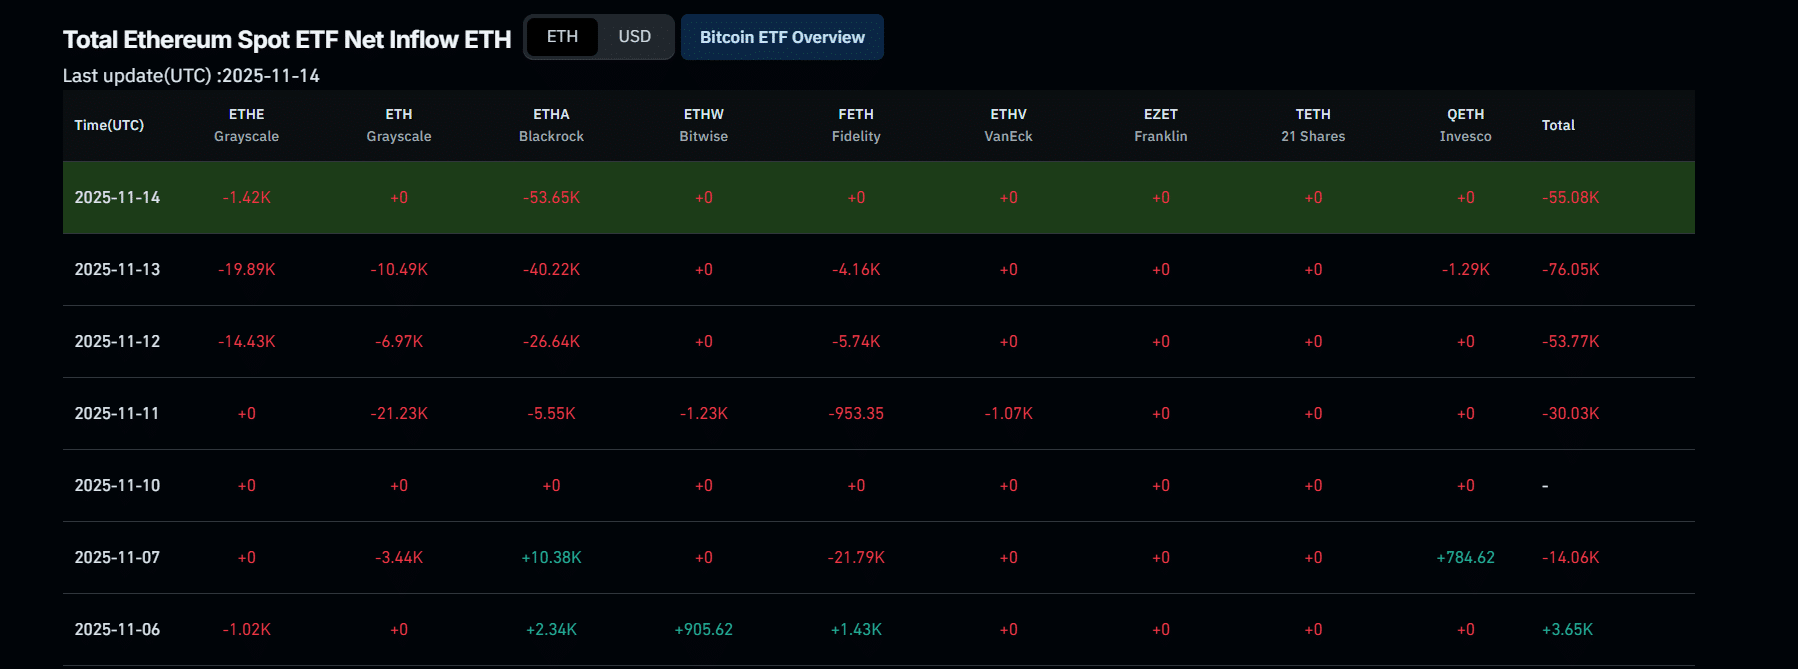
The drop came alongside a surge in ETF redemptions and growing concerns that Ethereum is becoming the “risk-on” trade of the sector. So what’s going on with Ethereum? Is it dying?
DISCOVER: 20+ Next Crypto to Explode in 2025
Ethereum Price Prediction? ETF Outflows Reveal a Confidence Gap
Investment manager Timothy Peterson highlighted a worrying trend that isn’t visible in headline ETF flows.
“Spot ether ETFs posted net outflows in four of the past five weeks, totaling roughly 7 percent of cost-basis capital,” Peterson said.

Cost-basis withdrawals track how much of the original capital committed to an ETF is leaving and it isn’t look good for Ethereum. Rising redemptions here show conviction weakening among long-term holders, not just traders repositioning.
It leaves our Ethereum price prediction showing that the price will not be near the ATH again for the rest of 2025. Not good.
DISCOVER: Next 1000X Crypto: 10+ Crypto Tokens That Can Hit 1000x in 2025
Ethereum Market Data Signals Growing Pressure, What’s Next?
A sweep across key analytics platforms adds more context to the ETH price:
- CoinGecko: Ether down 11 percent in 24 hours
- DeFi Llama: ETH TVL fell 2.1 percent this week, reversing prior gains
- FRED (Rates): Long-term yields remain elevated, restraining risk assets
Despite the volatility, ETH still trades comfortably above its 200-day moving average near $2,550, a level that has historically defined cycle support zones.

Ethereum’s 4-hour chart shows price locked inside a narrowing falling wedge, which is a corrective pattern that often precedes upside breaks. ETH has repeatedly been rejected at the upper trendline and the stacked supply zones near $3,550 and $3,800.
A decisive reclaim of $3,350 will flip the short-term trend and open a path back toward $3,550. Failure keeps the wedge intact and elevates the risk of a $3,000 retest or even a quick liquidity sweep below it before any true reversal.
Is Ethereum Dead or Not?
Ether slipping under $3,100 says more than a bad trading day. ETF outflows, shaky macro signals, and stubborn resistance have all piled onto the chart at the same time.
Even so, the deeper indicators still look solid, and the tightening wedge hints that a reversal could hit sooner than the mood suggests. Who knows, though. If there ever was a time for a project to flip Ethereum, it’s now.
EXPLORE: XRP Price Jumps 11% After SEC Crypto Unit Tease XRP ETF Progress
Key Takeaways
- Lamest bull market of my life. Bitcoin make it to 150k. Ethereum price predictions were wrong and ETH made a new ATH for all of two seconds.
- Ether slipping under $3,100 says more than a bad trading day.
The post ETH USD Is Trapped: Ethereum Price Prediction Sounds Alarm on Bear Channel appeared first on 99Bitcoins.


