SOL USD Heads For Reversal: Is Bottom In For Solana Price?
Last time we checked, Solana (SOL) wasn’t doing too well, with its price action sliding down below $130. Since then, its price has stabilised and is now trading at
.
In the last 24 hours,
![]()
Solana
2.58%
![]()
Solana
SOL
Price
$139.50
2.58% /24h
Volume in 24h
$7.05B
Price 7d
is up by 2% on the daily chart. Further analysing the weekly chart, it seems as if SOL has formed a bottom around $130, and a rebound is on the horizon for its price action to again test the $250 level.
Ever since November started, SOL has been facing negative pressure that saw its price drop from $180 to form a V-shaped recovery pattern on the short-term chart. This pattern usually indicates a rebound in the works after a steep fall.
Once SOL price action dropped below $130, buyers piled in to scoop up the crypto at lower prices, pushing its price back up. At the same time, the RSI (Relative Strength Index) climbed from 28 to its current position at 43, indicating a lot more room to grow before it reaches the overbought level.
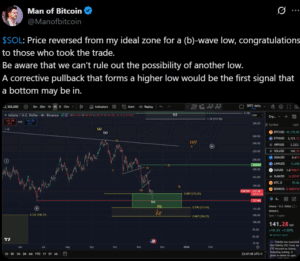
(Source: X)
If this momentum continues, SOL could see its price climb to $170, which currently acts as a resistance. Currently on the 4-hour chart, SOL has managed to claw back its 20-day EMA at $139 and is on its way to retest the 50-day EMA at $144.

(Source: TradingView)
The $130 level has sparked off major rallies in the past. One jump took SOL from $127 to $265 in just two months last year, and another saw it double from $130 to $250 between June and September this year.
EXPLORE: Top 20 Crypto to Buy in 2025
SOL Spot Buyers Step In: Price Recovery Brewing?
If data from CoinGlass is to be believed, interest in the SOL futures market is gaining steam again after a brief lull in action. In the last 24 hours, the total value of open futures positions, also known as open interest, has grown by 5%, reaching $7.3 billion.
At the same time, funding rates (cost of holding long positions) have turned slightly positive. This shift suggests that there is a change in market sentiment and that traders are now betting on SOL’s price to go up.

(Source: CoinGlass)
When both open interest and funding rates rise together, it usually means that demand for that particular crypto is returning.
Moreover, positive net taker volume highlights that more buyers are stepping up at current prices. The spot CVD (Cumulative Volume Delta), which tracks real buying pressure in the spot market, is also going up.

(Source: CryptoQuant)
This means that recovery in SOL’s price action is not just driven by futures traders, but also supported by real buying.
EXPLORE: 20+ Next Crypto to Explode in 2025
SOL ETFs See 15 Days Of Straight Inflows, 390M Daily Users
As with SOL funding rates and open futures going up, investor interest in the crypto is heating up as well. SOL spot ETFs have been on a 15-day inflow streak, highlighting strong demand from whales and institutions alike.
On Monday alone, US-based SOL ETFs bought in $8.26 million. Combined, these funds have attracted $390 million so far, with total assets now topping $593 million as per SoSoValue’s data.
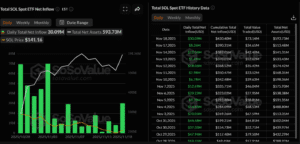
(Source: SoSoValue)
Meanwhile, VanEck launched its own SOL ETF this week, and more investment management firms are expected to follow suit, giving SOL price action more momentum.
EXPLORE: Next 1000X Crypto – Here’s 10+ Crypto Tokens That Can Hit 1000x This Year
Key Takeaways
- SOL price shows signs of recovery after forming a V-shaped reversal pattern
- Futures and spot market data confirm growing demand and bullish sentiment for Solana
- SOL ETFs attract $390M in inflows, boosting institutional interest and network activity
The post SOL USD Heads For Reversal: Is Bottom In For Solana Price? appeared first on 99Bitcoins.


