Bitcoin Price Analysis: Is BTC Heading to $80K or $96K Next?
Bitcoin continues to struggle below key resistance levels as the market attempts to stabilize after an extended sell-off. The asset remains inside the broader bullish order-flow zone, but the overall trend is still decisively bearish, with reclaims required before any meaningful reversal can develop.
Technical Analysis
By Shayan
The Daily Chart
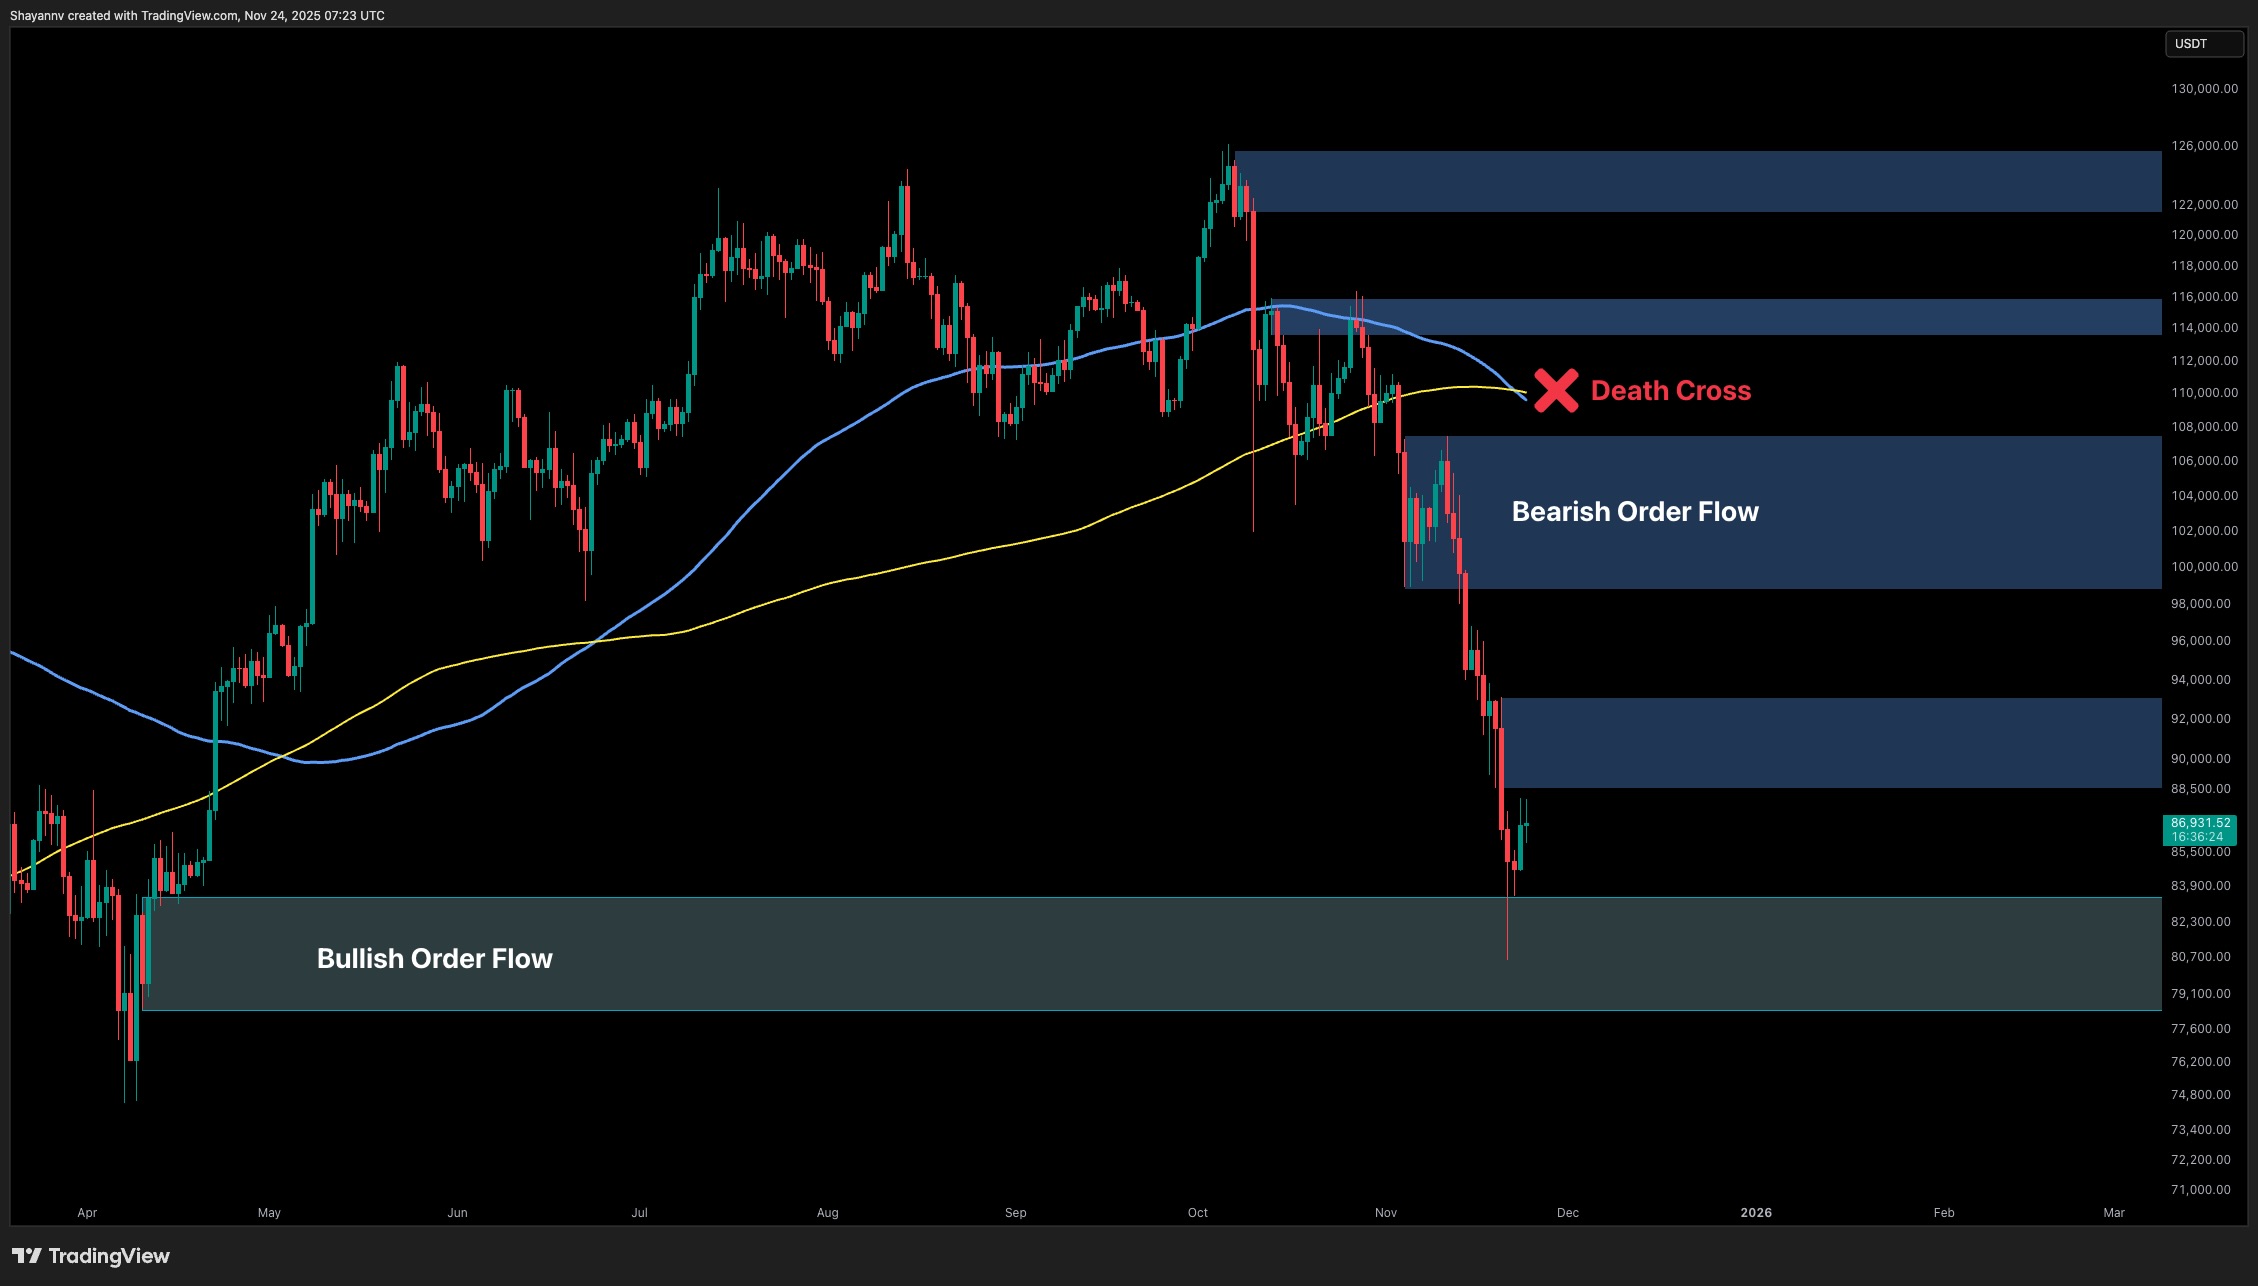
Bitcoin has retraced back toward the major bullish order-flow zone after failing to reclaim any high-timeframe structure. The death-cross between the 100-day and 200-day moving averages has now materialized, confirming a shift toward sustained bearish momentum as long as the price remains below the $100K–$104K region.
The latest wick toward $80K shows that liquidity beneath the prior macro low has been harvested. Buyers reacted aggressively at the lower boundary of the green accumulation zone, but the recovery remains corrective. As long as the market trades below the $92K–$96K supply cluster, this bounce should be treated as a relief move inside a broader downtrend.
If buyers establish stability above the $96K pivot, a mid-range retest of $100K–$104K becomes possible. Failure to reclaim that area leaves the door open for another deeper sweep toward the lower accumulation band between $80K and $83K.
The 4-Hour Chart
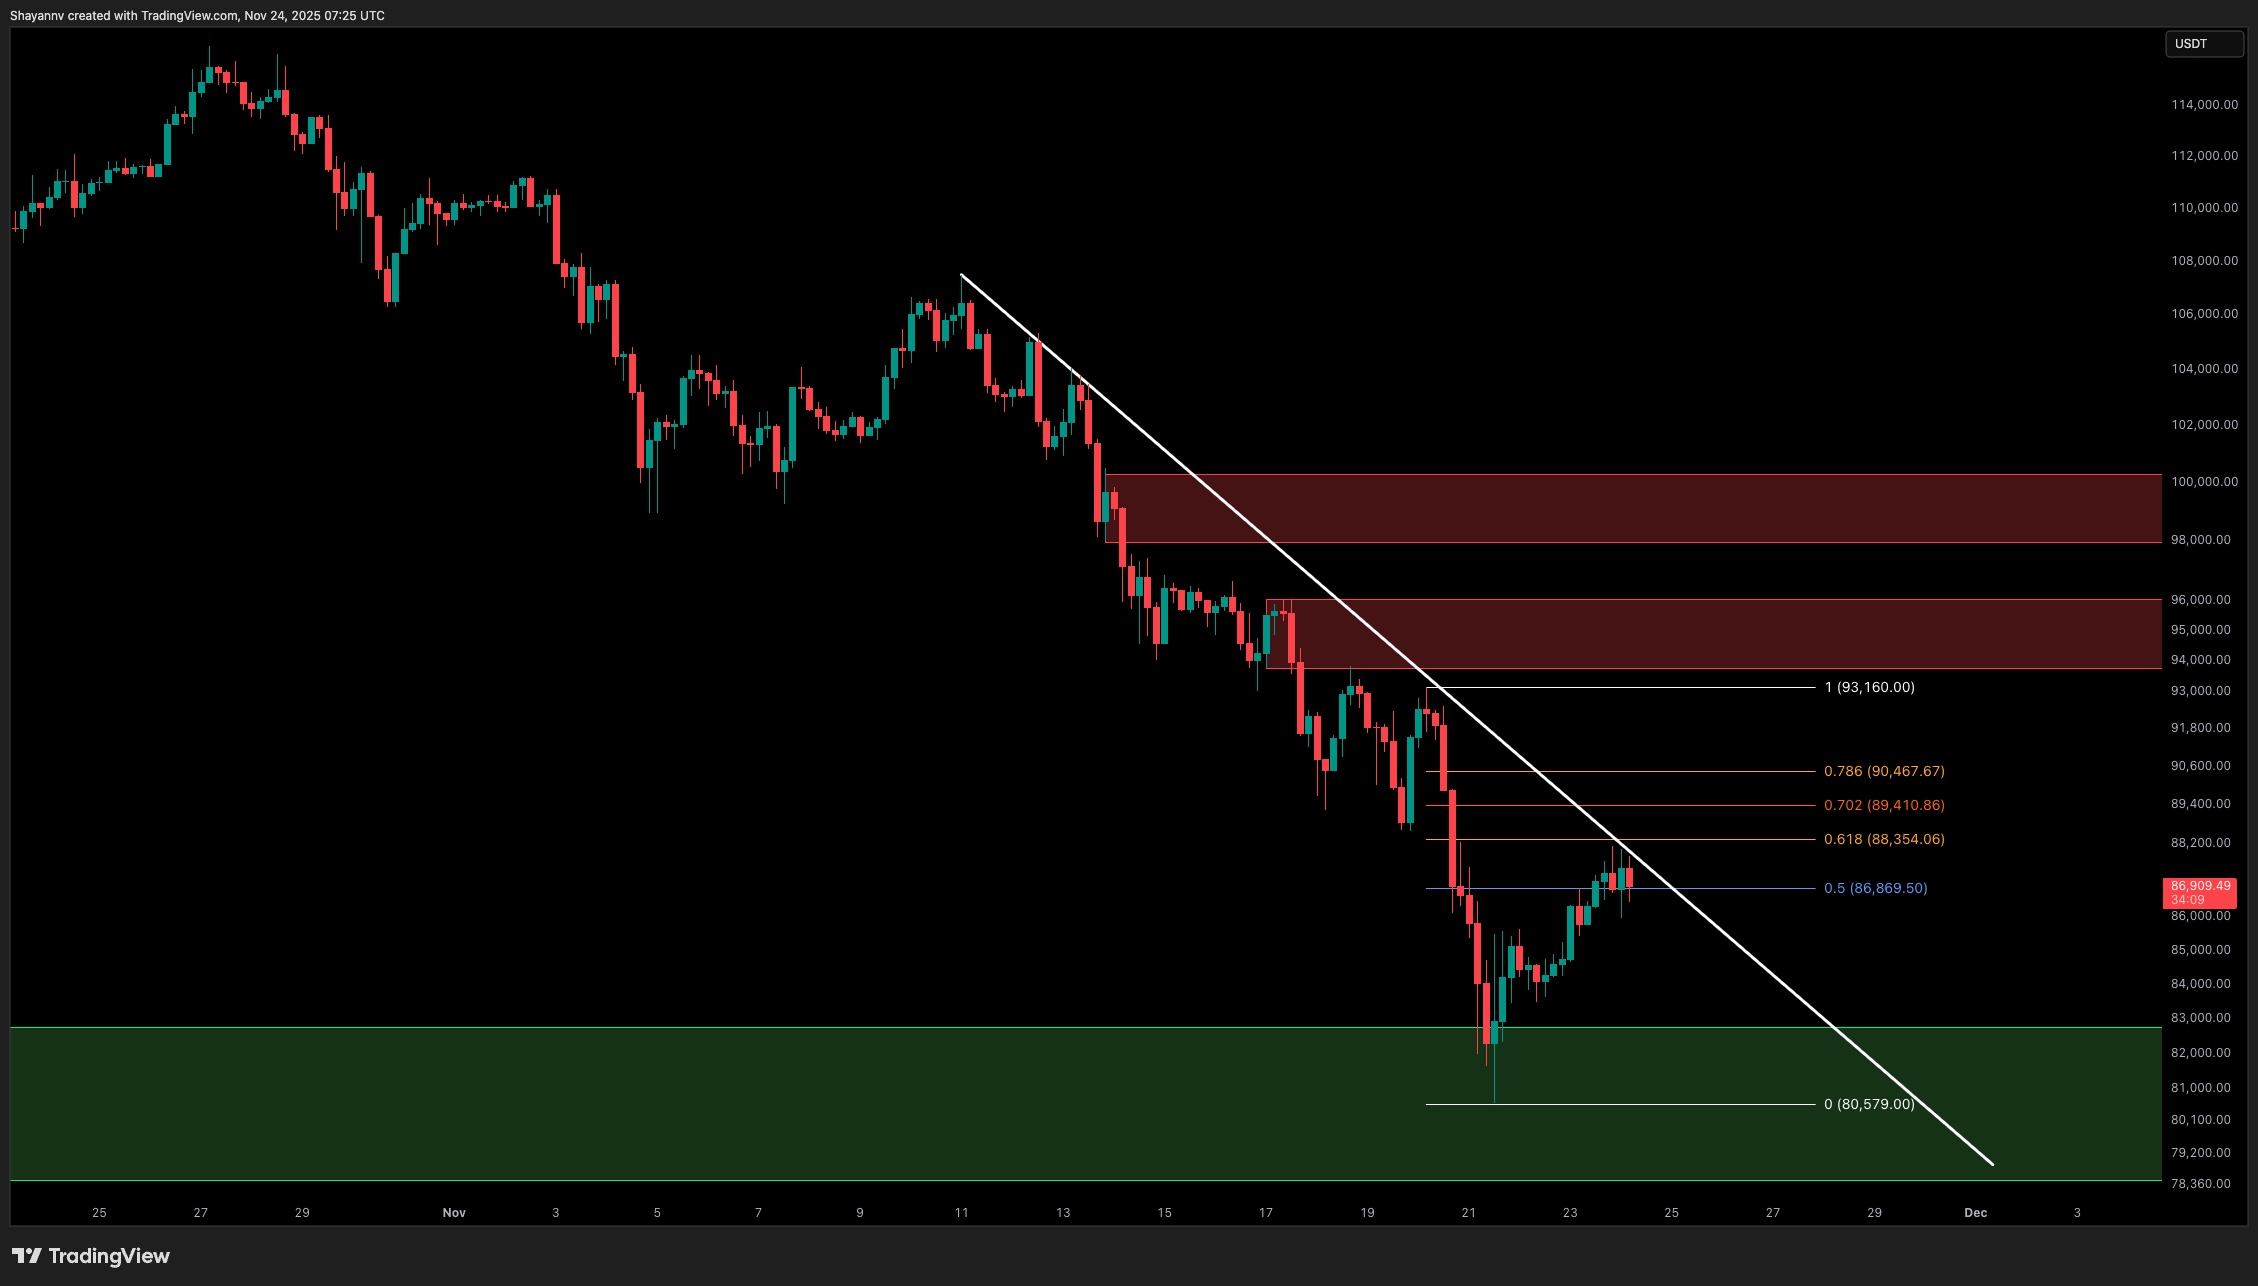
Short-term structure remains aligned to the downside, with the price respecting the descending trendline and each rally shutting down at lower supply levels. The most recent pullback stalled precisely at the 0.5–0.618 Fibonacci pocket, highlighting compression against the trendline.
Until the descending trendline is cleanly reclaimed, upside remains limited. A confirmed break above $90K–$92K would signal that momentum is rotating upward, opening a path toward the $96K–$98K inefficiency zone. Rejection from the current trendline, however, would likely send the asset back into the $83K–$86K support range, where the next volatility cluster sits.
On-chain Analysis
By Shayan
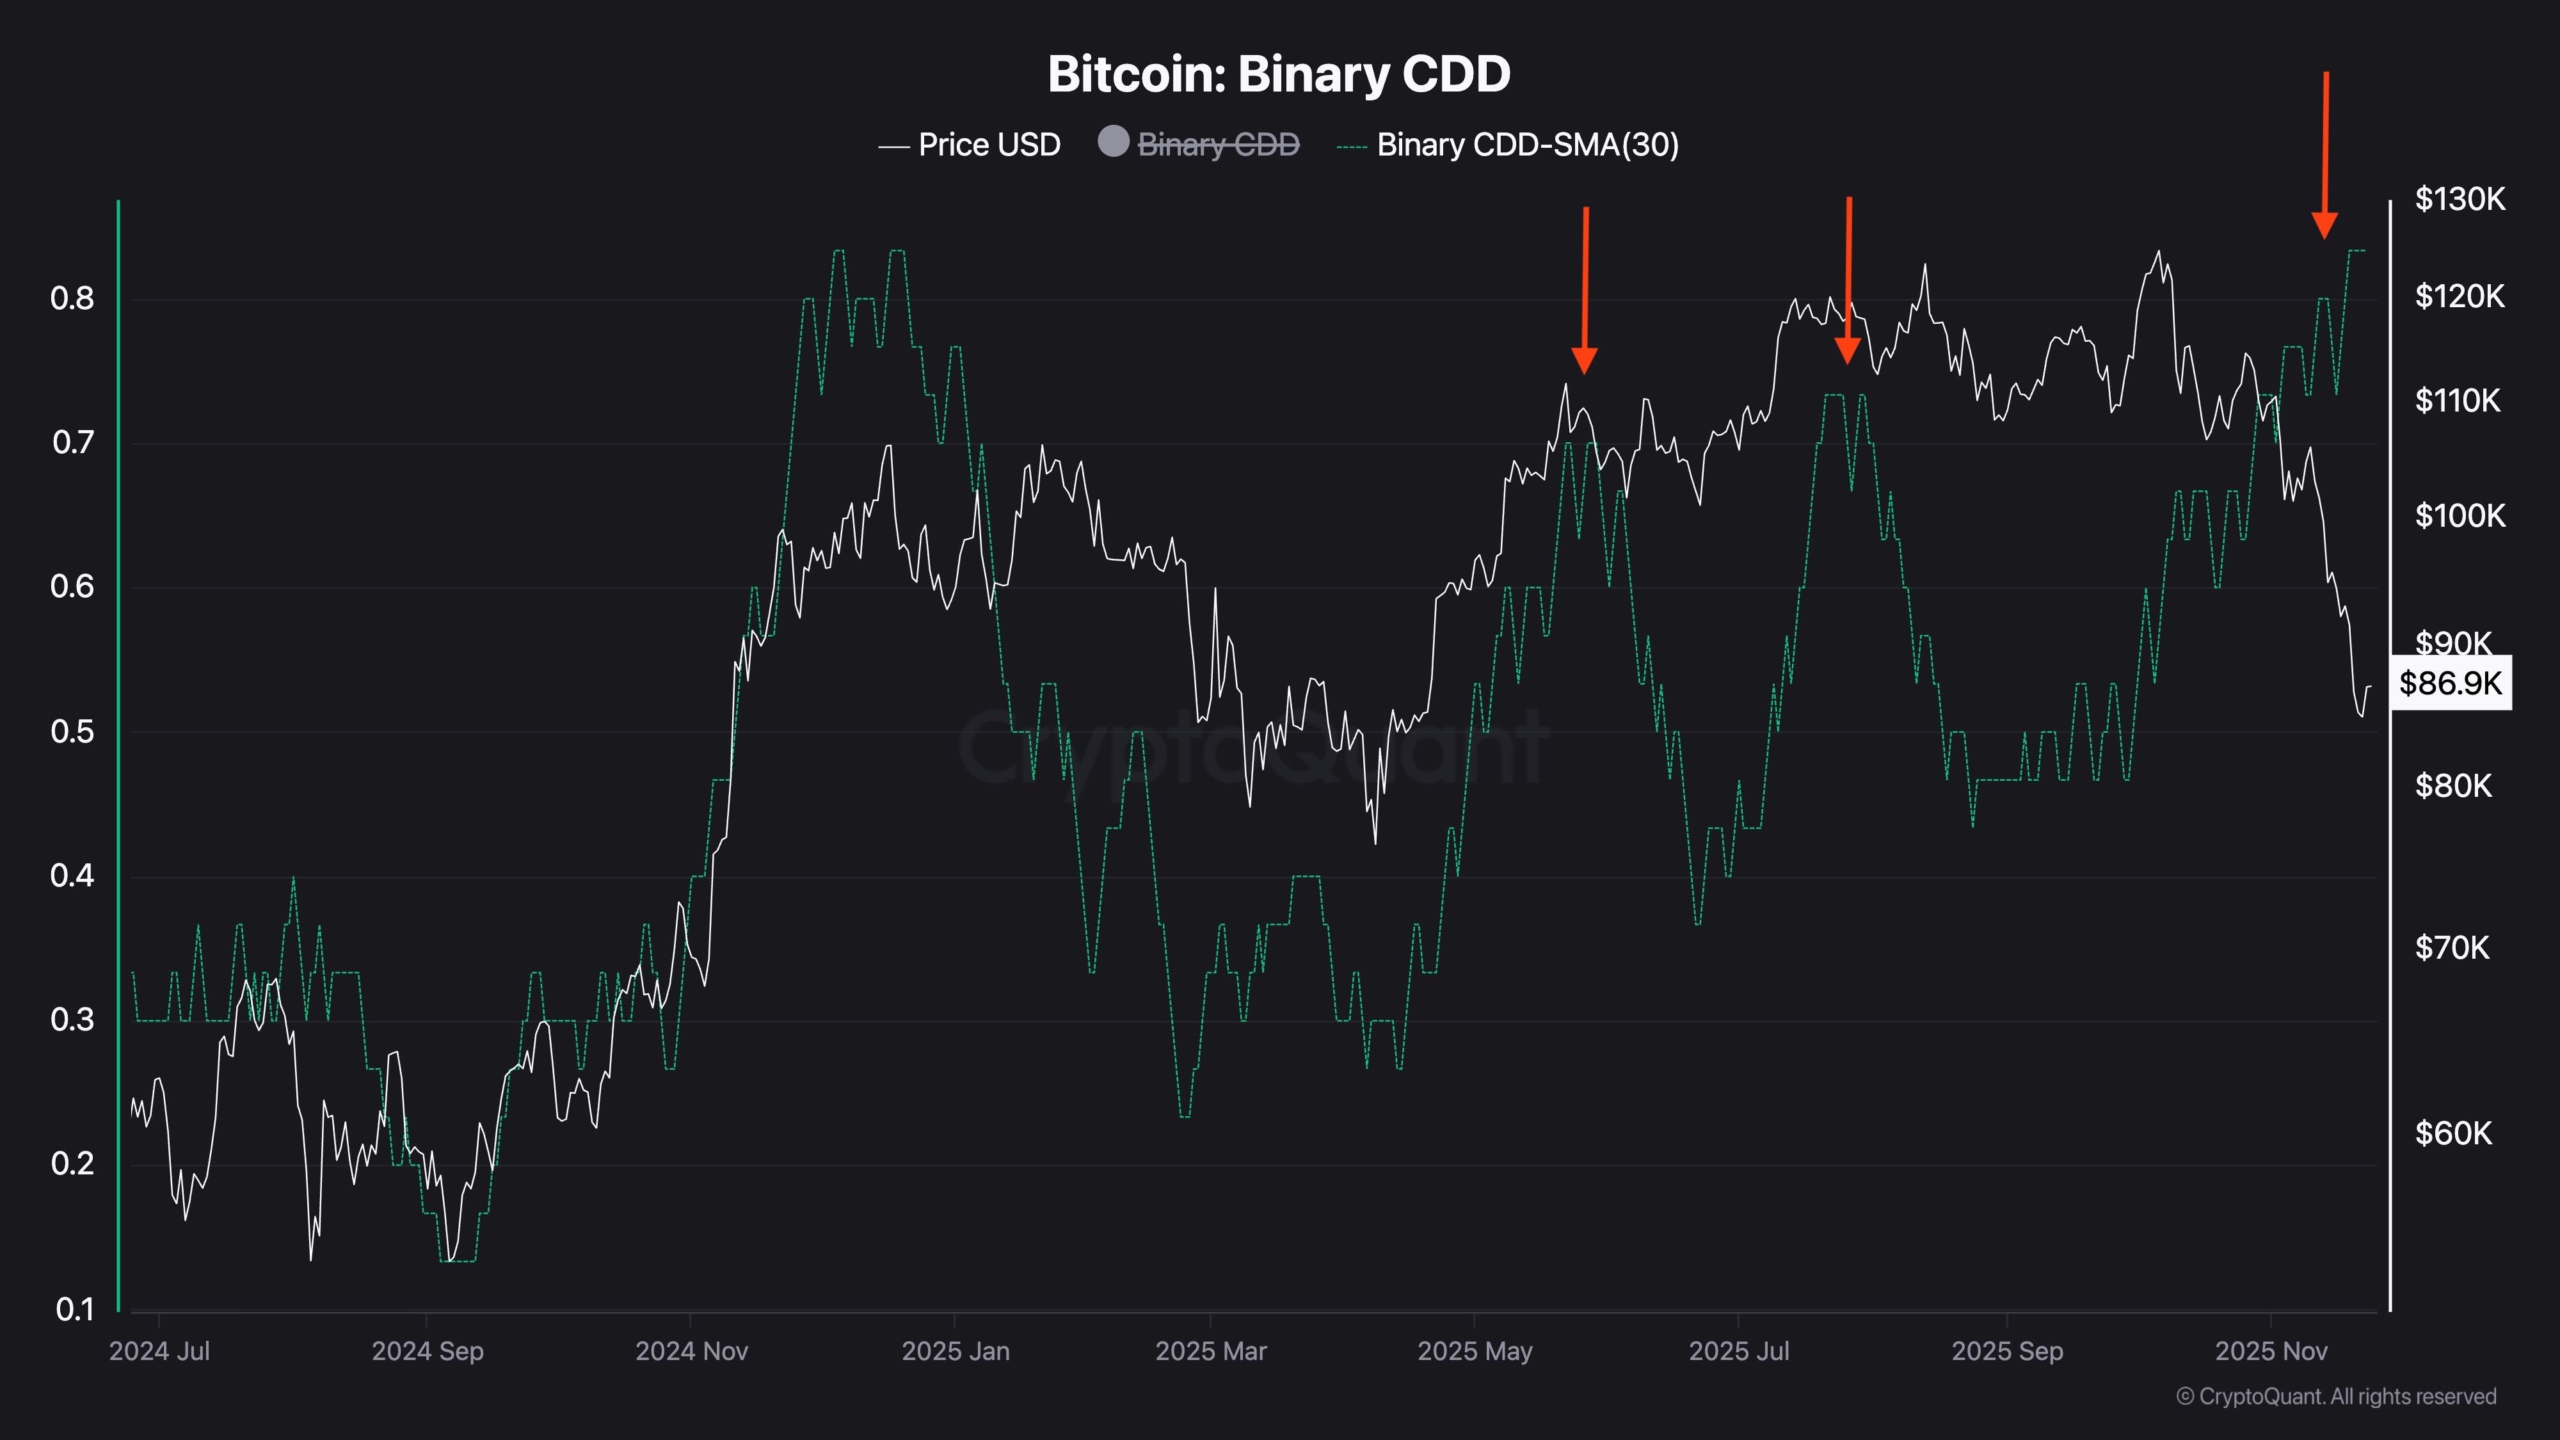
Bitcoin’s Binary CDD reveals a notable behavioral shift among long-term, smart-money holders. The three upward spikes marked on the chart clearly align with cycle highs, suggesting that experienced holders chose to quietly offload BTC into strength while retail participation was accelerating. Each spike coincided with a local or macro top, confirming that dormant supply was being reactivated at premium prices.
This pattern indicates that profit-taking from long-term holders began well before the market sold off, a classic hallmark of distribution phases.
At the same time, short-term holders have been capitulating aggressively. SOPR metrics show that STHs have spent weeks selling at losses, producing a deep capitulation band below 1.0. This combination, smart-money distribution at the top and reactive selling at the bottom, typically marks the later stages of a correction, not the early ones.
Although this does not imply an immediate reversal, the cleansing of weak hands and the absorption seen around the lower accumulation zone suggest that the market is transitioning into a potential accumulation phase. Sustained defense of the $80K–$83K realized-demand area would reinforce this scenario. A clean breakdown below that region, however, would signal that the final washout has not yet completed.
The post Bitcoin Price Analysis: Is BTC Heading to $80K or $96K Next? appeared first on CryptoPotato.


