VIX–Bitcoin Correlation Re-Emerges Amid Political And Monetary Uncertainty
Bitcoin is struggling to regain traction below the $90,000 level as the market navigates a dense mix of macro uncertainty and risk aversion. Price action remains hesitant, reflecting a broader environment where participants are increasingly focused on external signals rather than crypto-specific catalysts. According to insights from CryptoQuant, this Super Wednesday arrives with a strong market consensus: the Federal Reserve is widely expected to leave interest rates unchanged.
That expectation is reflected in volatile markets. The VIX at 16.89 places equities in a zone of moderate volatility, often interpreted as an alert level rather than outright panic. Yet despite stable rate expectations, the US dollar continues to weaken, highlighting that monetary policy is not the only driver shaping global capital flows.
The dollar’s softness has increasingly been linked to political and economic decisions associated with US President Donald Trump, adding another layer of uncertainty for investors.
As confidence in US assets wavers, capital has rotated toward perceived safe havens. This shift has fueled a renewed rally in gold and silver, underscoring a defensive posture across markets. In this context, Bitcoin’s inability to reclaim $90K reflects its sensitivity to broader risk sentiment. Rather than acting as an immediate refuge, BTC remains caught between macro caution and the absence of a clear directional trigger, leaving the market in a fragile and reactive state.
VIX–Bitcoin Correlation Highlights Sensitivity To Macro Stress
According to the report, the VIX–BTC Risk Correlation becomes a key framework for interpreting Bitcoin’s behavior in the current macro environment. This indicator tracks how spikes in traditional market volatility, measured by the VIX, align with local and cyclical bottoms in Bitcoin. Rather than acting as a timing signal, it functions as a stress thermometer, helping assess when risk in traditional finance begins to translate into inflection points in the crypto market.
Historical context reinforces its relevance. During 2025, Bitcoin declined in 6 of the 7 FOMC meetings, with an average drop of 7.47% in the surrounding days. Policy expectations remain anchored, with the current federal funds rate in the 3.50%–3.75% range, the lowest since September 2022. At the same time, the Federal Reserve has announced plans to repurchase $40 billion in Treasury Bills over 30 days, adding liquidity without signaling an imminent rate cut.

On the volatility side, the VIX at 16.89 places markets in an alert zone of moderate stress. Historically, this same correlation framework flagged the last two local Bitcoin bottoms of the current cycle and also identified the bottom of the previous bear market.
The conclusion is not that a bottom is guaranteed, but that risk remains elevated. With markets pricing a rate cut only for March or September, Bitcoin continues to trade in sync with US-driven stress, making Super Wednesday another key test of the volatility–Bitcoin relationship.
Price Momentum Remains Fragile
Bitcoin price action on the daily chart shows a market trapped in a fragile consolidation after a sharp corrective phase. BTC is trading around the $89,000 area, struggling to regain momentum after failing to reclaim the descending cluster of moving averages.
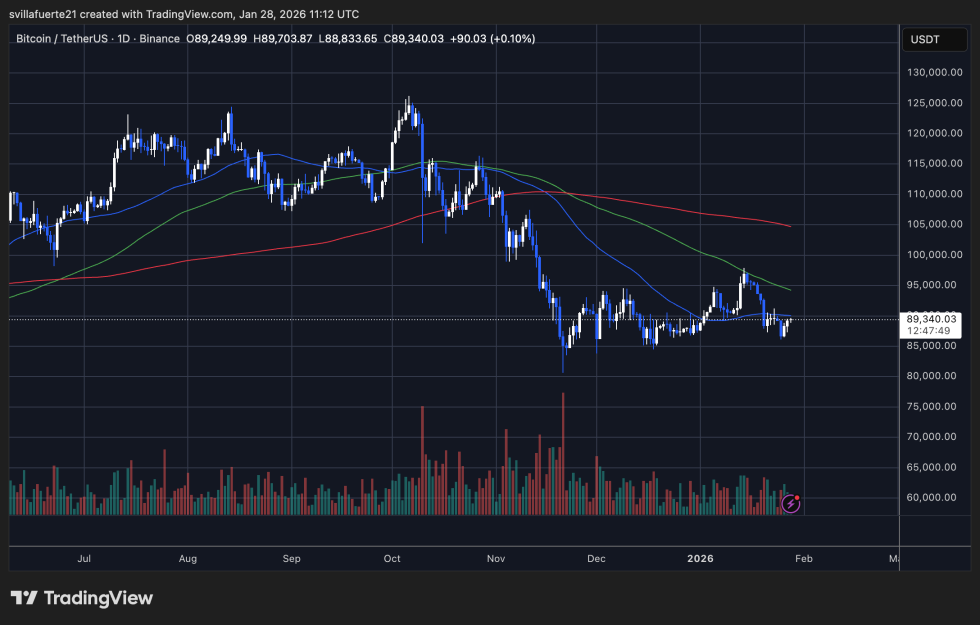
The 50-day SMA (blue) continues to slope downward and acts as dynamic resistance, while the 100-day SMA (green) is also trending lower, reinforcing the bearish medium-term structure. Above them, the 200-day SMA (red) remains intact but far from price, signaling that long-term trend support is still present, yet not immediately actionable.
The sell-off from the October highs established a clear lower-high and lower-low sequence, confirming a trend shift from expansion to distribution. Since the December low near the mid-$80,000s, price has stabilized but remains capped below the $92,000–$94,000 zone, where prior demand flipped into resistance. Volume has declined during the recent sideways movement, suggesting reduced participation and a lack of conviction from both buyers and sellers.
Structurally, this is a compression phase rather than a confirmed reversal. Holding above the $86,000–$87,000 support range is critical to avoid renewed downside pressure. However, without a decisive reclaim of the 50- and 100-day averages, upside attempts remain corrective in nature.
The market is paused, not resolved, and direction will depend on whether demand returns with volume or sellers regain control.
Featured image from ChatGPT, chart from TradingView.com


